AUD/USD Forecast: Battle around 0.6500 likely to continue

AUD/USD Current Price: 0.6503
- RBA Bullock showed a willingness to cut interest rates if conditions grant so.
- Australia will release only minor data on Friday, the US calendar will be empty.
- AUD/USD is neutral in the near term, but buyers may gain impetus in Asia.
The AUD/USD pair hovers around 0.6500, trimming Asian losses but unable to extend its positive momentum. The sour tone of Asian equities helped the US Dollar advance against its Australian rivals, although the better tone of European indexes limited AUD/USD slide. With United States (US) markets closed amid the Thanksgiving Holiday, no additional action is expected ahead of Friday’s opening.
Data-wise, Australia published Q3 Private Capital Expenditure, which came in better than anticipated, improving to 1.1% from the -2.2% posted in Q2. Additionally, Reserve Bank of Australia (RBA) Governor Michelle Bullock spoke early in the European session, noting the central bank aims for inflation to stabilize around 2.5%, adding that if it falls quicker than forecast, the Board can respond in a timely manner. Finally, Bullock said: “We do not need inflation to be at target to cut, but we need to be sure it's heading there.”
The Australian calendar will include minor data on Friday, as the country will release the October Private Sector Credit report. The US calendar will be empty, as local markets are due to close earlier than usual as an extension to the Thanksgiving holiday.
AUD/USD short-term technical outlook
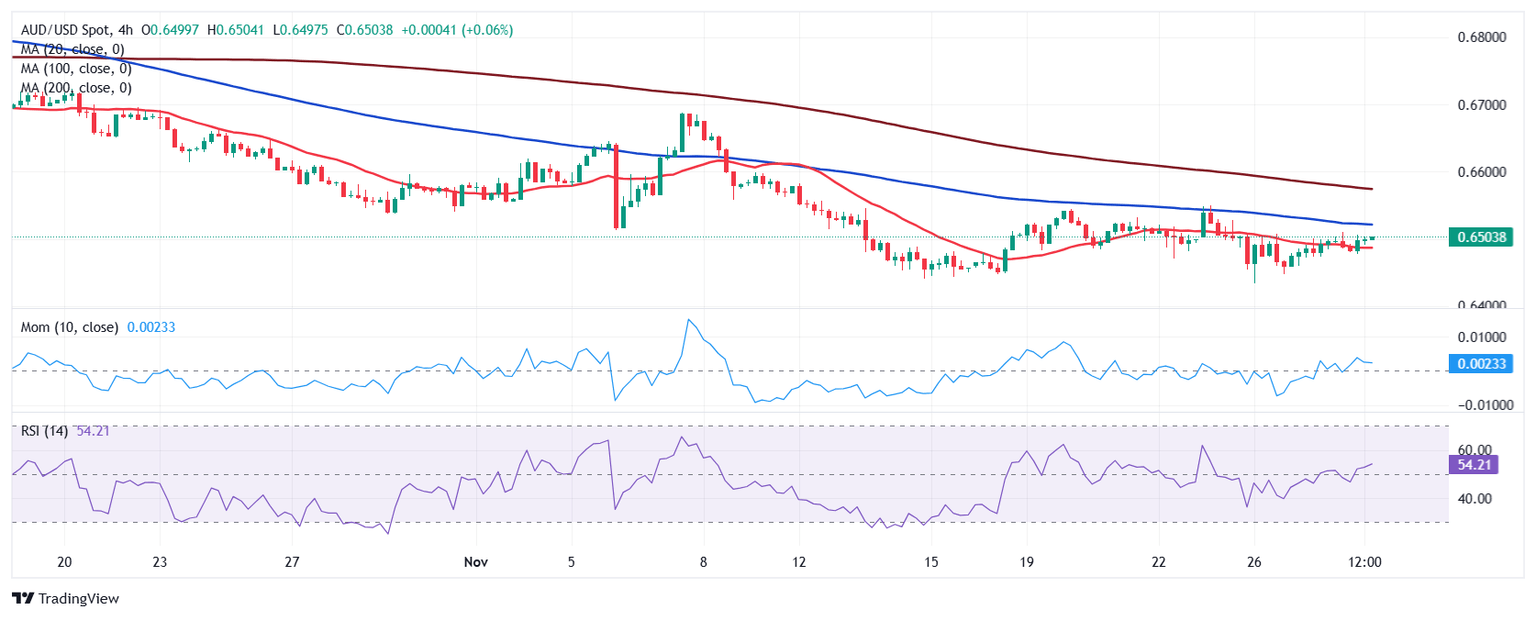
The daily chart for the AUD/USD pair shows it managed to post a higher high and a higher low, which favors another leg north. Still, the same chart shows that the pair develops below all its moving averages, with the 20 Simple Moving Average (SMA) heading firmly lower above the current level while below the longer ones, capping the upside at around 0.6530. At the same time, technical indicators remain within negative levels, hovering within familiar levels. Only the Momentum indicator advances, yet below its recent highs, not enough to support a continued advance.
The near-term picture is neutral. The 4-hour chart shows that AUD/USD hovers between bearish 20 and 100 SMAs, with the shorter one providing support at around 0.6485. Finally, technical indicators have turned flat just above their midlines, falling to provide clear directional clues.
Support levels: 0.6485 0.6440 0.6400
Resistance levels: 0.6530 0.6570 0.6610
Premium
You have reached your limit of 3 free articles for this month.
Start your subscription and get access to all our original articles.
Author

Valeria Bednarik
FXStreet
Valeria Bednarik was born and lives in Buenos Aires, Argentina. Her passion for math and numbers pushed her into studying economics in her younger years.


