AUD/USD Elliott Wave technical analysis [Video]
![AUD/USD Elliott Wave technical analysis [Video]](https://editorial.fxstreet.com/images/Markets/Currencies/Majors/AUDUSD/macro-of-aussie-20-note-8668638_XtraLarge.jpg)
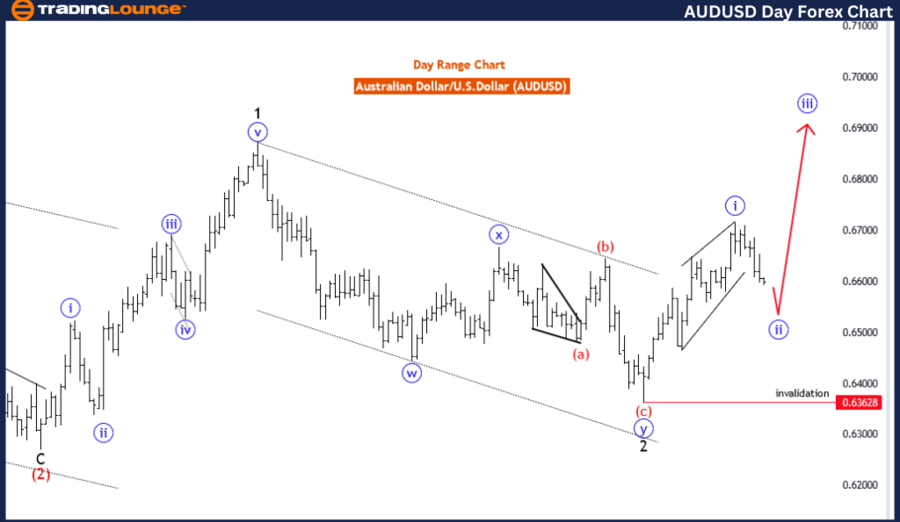
Australian Dollar/U.S.Dollar (AUDUSD) Day Chart
AUD/USD Elliott Wave technical analysis
Function: Trend
Mode: Corrective
Structure: Blue wave 2
Position: Black wave 3
Direction next higher degrees: Blue wave 2
Details: Blue wave 1 looking completed at 0.67165. Now blue wave 2 of 3 is in play.
Wave cancel invalid level: 0.63628
The AUDUSD Elliott Wave analysis on the day chart examines the market using Elliott Wave theory to understand the ongoing trend and forecast future movements. The current market function is identified as a trend, indicating that the price movements are generally following a predictable pattern that can be analyzed and projected.
The mode of the market movement is corrective, suggesting that the market is in a phase of adjustment or retracement within the larger trend. Specifically, the structure being analyzed is blue wave 2, which is part of a larger corrective pattern within the broader trend.
The market is currently positioned in black wave 3, meaning it is in the third wave of a larger five-wave sequence. This position within the wave sequence indicates that the market is in a significant phase of movement that often involves substantial price shifts.
Looking to the next higher degrees, the analysis suggests a transition to blue wave 3 after the completion of the current corrective phase (blue wave 2). This indicates that following the correction, the market is expected to resume its primary trend with an impulsive wave, which is typically characterized by strong and decisive price movements.
The details of the analysis highlight that blue wave 1 has been completed at a specified level, marking the end of the initial phase of the trend. Now, blue wave 2 of 3 is in play, indicating that the market is undergoing a correction before it resumes the primary trend direction with blue wave 3.
A critical aspect of this analysis is the wave cancel invalid level, set at a specific point. This level serves as a threshold; if the market price drops below this point, it would invalidate the current wave count and necessitate a reassessment of the wave structure and market projections. Monitoring this level is essential to confirm the validity of the wave pattern and ensure accurate predictions.
In summary, the AUDUSD on the day chart is currently in a corrective phase within blue wave 2 of a larger trend. The market is expected to complete this correction before transitioning to blue wave 3, marking a return to the primary trend. The wave cancel invalid level is a crucial point to watch to validate the current analysis and future forecasts.
AUD/USD four-hour chart
Function: Counter Trend
Mode: corrective
Structure: Red wave C
Position: Blue wave 2
Direction next higher degrees: Blue wave 3
Details: Red wave B of 2 looking completed, now red wave C of 2 is in paly.
Wave cancel invalid level: 0.63628
The AUDUSD Elliott Wave analysis on the 4-hour chart focuses on the current market trends using Elliott Wave theory. This analysis identifies the prevailing function as a counter-trend, suggesting that the market is moving against the primary trend, undergoing a temporary correction or retracement phase.
The mode of this market movement is corrective, which is characterized by a structure designed to counter the preceding trend. Specifically, the structure under examination is red wave C, which is part of a larger corrective wave pattern. In this context, the market is currently positioned in blue wave 2, indicating that the market is in the process of completing a correction before potentially resuming the primary trend.
The analysis suggests that the direction in the next higher degrees will be blue wave 3. This implies that after the completion of the current corrective phase (blue wave 2), the market is expected to enter a new impulsive phase, characterized by stronger and more decisive price movements in the direction of the primary trend.
The details provided indicate that red wave B of blue wave 2 appears to be completed, and now red wave C of blue wave 2 is in play. This phase involves the market completing its corrective movements before potentially resuming its primary trend direction. The completion of red wave C will mark the end of the corrective phase (blue wave 2), setting the stage for the next impulsive wave (blue wave 3).
A crucial aspect of this analysis is the wave cancel invalid level, set at 0.63628. This level serves as a critical threshold; if the market price drops below this point, it would invalidate the current wave count, necessitating a reassessment of the wave structure and the market’s projected direction. Monitoring this level is essential to confirm the validity of the wave pattern and ensure accurate market predictions.
In summary, the AUDUSD is currently in a counter-trend on the 4-hour chart, undergoing a corrective phase within blue wave 2. The market is expected to complete red wave C before transitioning to blue wave 3, marking a return to the primary trend. Keeping an eye on the invalidation level is crucial to validate the current wave count and ensure the accuracy of future market forecasts.

AUD/USD Elliott Wave technical analysis [Video]
Author

Peter Mathers
TradingLounge
Peter Mathers started actively trading in 1982. He began his career at Hoei and Shoin, a Japanese futures trading company.


