|

WTI technical analysis: Buyers struggle around key resistance-zone

  • 50-DMA and 38.2% Fibonacci retracement question WTI bulls.
  • Four-month-old falling trend-line adds to the resistance.

WTI buyers seem losing momentum as the oil benchmark seesaws near key resistance-confluence while taking rounds to $56.50 ahead of Friday’s European session.

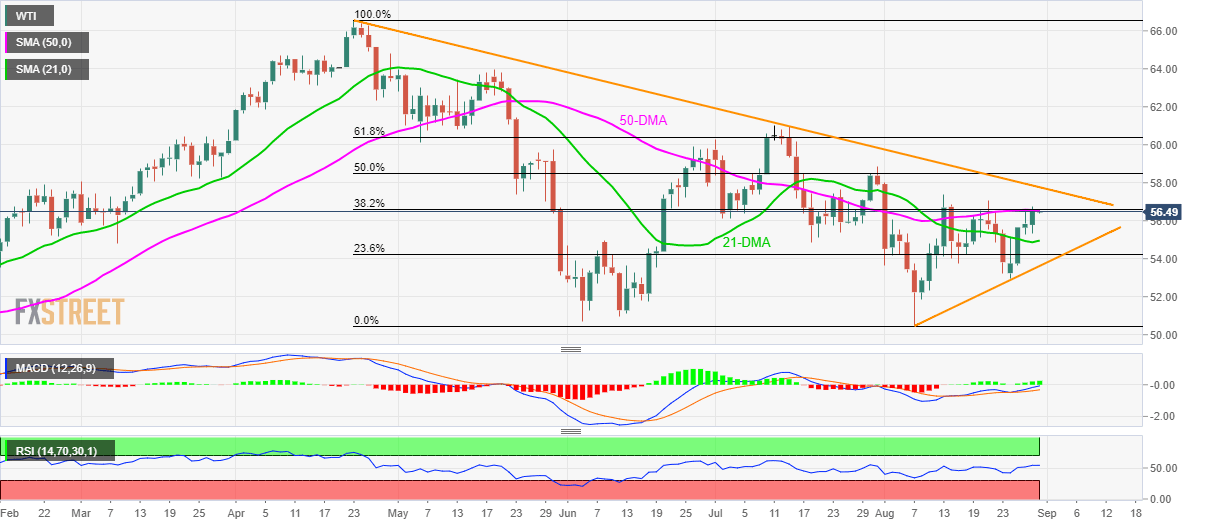
The black needs to cross the $56.55/60 area including 50-day simple moving average (DMA) and 38.2% Fibonacci retracement of April-August downpour in order to extend the run-up towards a falling trend-line since late-April, at $57.80.

In a case where prices keep rallying above $57.80, July 31 high around $58.85, 61.8% Fibonacci retracement level of $60.40 and $61.00 comprising July month top will please the WTI bulls.

On the downside, 21-DMA level of $55.00 and 23.6% Fibonacci retracement of $54.25 can entertain sellers ahead of challenging the momentum with three-week-old rising trend-line at $53.50.

WTI daily chart

Trend: pullback expected

Additinal important levels

Overview
Today last price56.49
Today Daily Change0.01
Today Daily Change %0.02%
Today daily open56.48
 
Trends
Daily SMA2054.88
Daily SMA5056.57
Daily SMA10058.11
Daily SMA20056.24
Levels
Previous Daily High56.76
Previous Daily Low55.33
Previous Weekly High57.08
Previous Weekly Low53.22
Previous Monthly High60.99
Previous Monthly Low54.87
Daily Fibonacci 38.2%56.21
Daily Fibonacci 61.8%55.88
Daily Pivot Point S155.62
Daily Pivot Point S254.76
Daily Pivot Point S354.19
Daily Pivot Point R157.05
Daily Pivot Point R257.62
Daily Pivot Point R358.48

Author

Anil Panchal

Anil Panchal

FXStreet

Anil Panchal has nearly 15 years of experience in tracking financial markets. With a keen interest in macroeconomics, Anil aptly tracks global news/updates and stays well-informed about the global financial moves and their implications.

More from Anil Panchal
Share:

Editor's Picks

EUR/USD flirts with daily highs, retargets 1.1900

EUR/USD regains upside traction, returning to the 1.1880 zone and refocusing its attention to the key 1.1900 barrier. The pair’s slight gains comes against the backdrop of a humble decline in the US Dollar as investors continue to assess the latest US CPI readings and the potential Fed’s rate path.

GBP/USD remains well bid around 1.3650

GBP/USD maintains its upside momentum in place, hovering around daily highs near 1.3650 and setting aside part of the recent three-day drop. Cable’s improved sentiment comes on the back of the Greenback’s  irresolute price action, while recent hawkish comments from the BoE’s Pill also collaborate with the uptick.

Gold clings to gains just above $5,000/oz

Gold is reclaiming part of the ground lost on Wednesday’s marked decline, as bargain-hunters keep piling up and lifting prices past the key $5,000 per troy ounce. The precious metal’s move higher is also underpinned by the slight pullback in the US Dollar and declining US Treasury yields across the curve.

Crypto Today: Bitcoin, Ethereum, XRP in choppy price action, weighed down by falling institutional interest 

Bitcoin's upside remains largely constrained amid weak technicals and declining institutional interest. Ethereum trades sideways above $1,900 support with the upside capped below $2,000 amid ETF outflows.

Week ahead – Data blitz, Fed Minutes and RBNZ decision in the spotlight

US GDP and PCE inflation are main highlights, plus the Fed minutes. UK and Japan have busy calendars too with focus on CPI. Flash PMIs for February will also be doing the rounds. RBNZ meets, is unlikely to follow RBA’s hawkish path.

Ripple Price Forecast: XRP potential bottom could be in sight

Ripple edges up above the intraday low of $1.35 at the time of writing on Friday amid mixed price actions across the crypto market. The remittance token failed to hold support at $1.40 the previous day, reflecting risk-off sentiment amid a decline in retail and institutional sentiment.