|

WTI Technical Analysis: 200-week EMA, 50% Fibonacci guard immediate upside

  • WTI fails to extend last week’s run-up, pulls back from 200-week EMA.
  • Five-week-old rising trend line gains sellers’ attention, multi-month long resistance will lure buyers past-50% Fibonacci retracement.

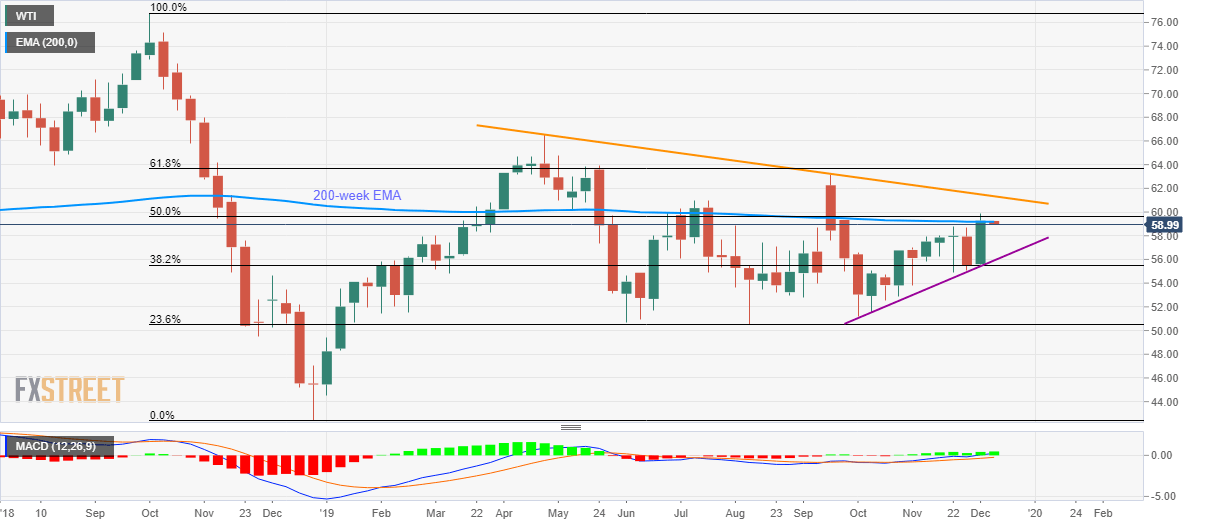
WTI drops to sub-$59.00 area during early Monday. The pair’s failed to provide a decisive break beyond 200-week Exponential Moving Average (EMA) and 50% Fibonacci retracement of October-December 2018 fall.

The energy benchmark now seems to extend declines towards $57.00 while an upward sloping trend line since early October, at $55.90, can act as an intermediate halt to its downpour towards 38.2% Fibonacci retracement of $55.50.

During the black gold’s declines below $55.50, August month low near $50.50 and $50.00 round-figure will be on the Bears’ radars.

On the flip side, a weekly closing beyond 50% Fibonacci retracement level of $59.60 can take aim at a multi-month-old descending resistance line, at $61.33.

However, the price rally beyond $61.33 enables the Bulls to question September high of $63.13 while also targeting the yearly top surrounding $66.60 during further upside.

WTI weekly chart

Trend: Pullback expected

additional important levels

Overview
Today last price58.99
Today Daily Change-0.28
Today Daily Change %-0.47%
Today daily open59.27
 
Trends
Daily SMA2057.44
Daily SMA5055.78
Daily SMA10055.91
Daily SMA20057.67
 
Levels
Previous Daily High59.9
Previous Daily Low57.77
Previous Weekly High59.9
Previous Weekly Low55.41
Previous Monthly High58.76
Previous Monthly Low54.12
Daily Fibonacci 38.2%59.09
Daily Fibonacci 61.8%58.58
Daily Pivot Point S158.06
Daily Pivot Point S256.85
Daily Pivot Point S355.93
Daily Pivot Point R160.19
Daily Pivot Point R261.11
Daily Pivot Point R362.32

Author

Anil Panchal

Anil Panchal

FXStreet

Anil Panchal has nearly 15 years of experience in tracking financial markets. With a keen interest in macroeconomics, Anil aptly tracks global news/updates and stays well-informed about the global financial moves and their implications.

More from Anil Panchal
Share:

Markets move fast. We move first.

Orange Juice Newsletter brings you expert driven insights - not headlines. Every day on your inbox.

By subscribing you agree to our Terms and conditions.

Editor's Picks

EUR/USD: Sellers attack 1.1700 as USD stages a solid comeback

EUR/USD attacks 1.1700 amid heavy selling interest in the European trading hours on Wednesday. A solid comeback staged by the US Dollar weighs heavily on the pair, as traders look to USD short covering ahead of US CPI on Thursday. However, the downside could be capped by hawkish ECB expectations. 

GBP/USD slides toward 1.3300 after softer-than-expected UK inflation data

GBP/USD has come under intense selling pressure, eyeing 1.3300 in the European session on Wednesday. The UK annual headline and core CPI rose by 3.2% each, missing estimates of 3.5% and 3.4%, respectively, reaffirming dovish BoE expectations and smashing the Pound Sterling across the board. 

Gold: Bulls await breakout through multi-day-old range amid Fed rate cut bets

Gold attracts fresh buyers during the Asian session on Wednesday, though it remains confined in a multi-day-old trading range amid mixed fundamental cues. The global risk sentiment remains on the defensive amid economic woes and fears of the AI bubble burst. Moreover, dovish US Federal Reserve expectations lend support to the non-yielding yellow metal, though a modest US Dollar uptick might cap any further appreciating move.

Bitcoin, Ethereum and Ripple extend correction as bearish momentum builds

Bitcoin, Ethereum, and Ripple remain under pressure as the broader market continues its corrective phase into midweek. The weak price action of these top three cryptocurrencies by market capitalization suggests a deeper correction, as momentum indicators are beginning to tilt bearish.

Ukraine-Russia in the spotlight once again

Since the start of the week, gold’s price has moved lower, but has yet to erase the gains made last week. In today’s report we intend to focus on the newest round of peace talks between Russia and Ukraine, whilst noting the release of the US Employment data later on day and end our report with an update in regards to the tensions brewing in Venezuela.

AAVE slips below $186 as bearish signals outweigh the SEC investigation closure

Aave (AAVE) price continues its decline, trading below $186 at the time of writing on Wednesday after a rejection at the key resistance zone. Derivatives positioning and momentum indicators suggest that bearish forces still dominate in the near term.