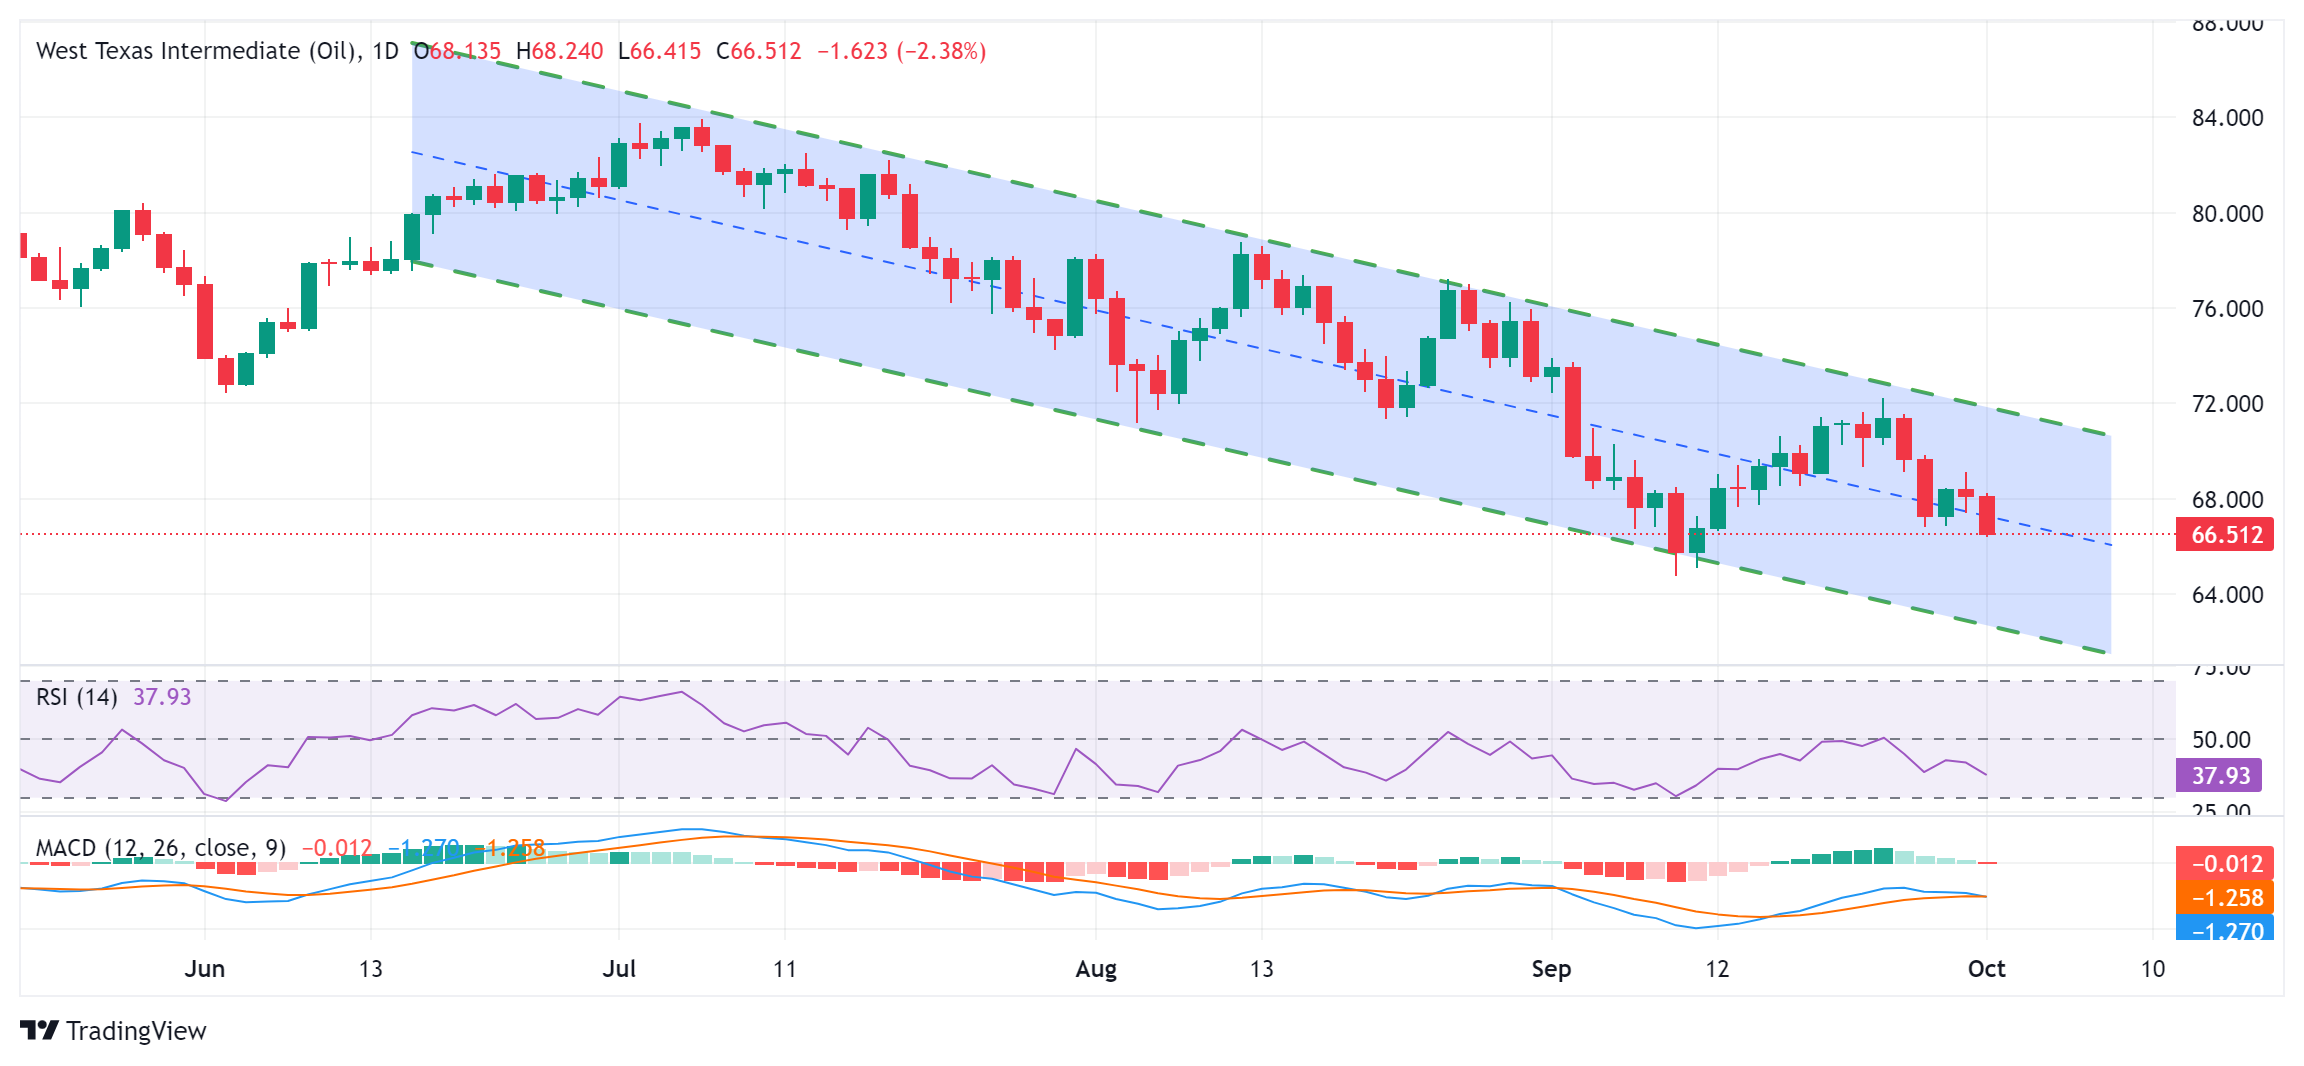
WTI Price Forecast: Dives to nearly three-week low, seems vulnerable around mid-$66.00s
- WTI slumps to a multi-week low amid supply concerns, tepid global demand growth.
- The formation of a descending channel supports prospects for a further near-term fall.
- Any attempted recovery is likely to confront stiff resistance near the $67.30 region.

West Texas Intermediate (WTI) US crude Oil prices come under heavy selling pressure on Tuesday and drop to a nearly three-week low, around mid-$66.00s during the first half of the European session.
Against the backdrop of sluggish global fuel demand growth, reports that OPEC+ is set to increase output by 180,000 barrels per day (bpd) in December overshadow fears that a widening conflict in the Middle East could curtail crude supply. This, along with some follow-through US Dollar (USD) buying, bolstered by the Federal Reserve (Fed) Chair Jerome Powell's relatively hawkish remarks on Monday, turn out to be key factors weighing on Crude Oil prices.
From a technical perspective, the recent decline witnessed over the past three months or so, along a downward-sloping channel, points to a well-established bearish trend and supports prospects for deeper losses. Moreover, oscillators on the daily chart are holding in negative territory and are still far from being in the oversold zone. This, in turn, validates the bearish outlook and suggests that the path of least resistance for Crude Oil prices remains to the downside.
Meanwhile, some follow-through selling below the $66.00 round figure will reaffirm the negative bias and could drag the black liquid to the $65.00 psychological mark en route to the $64.75 region, or the lowest level since May 2023 touched last month. The downward trajectory could eventually drag Crude Oil prices below the $64.00 mark, towards challenging the lower boundary of the aforementioned trend-channel, currently pegged near the $63.00-$62.90 region.
On the flip side, any attempted recovery now seems to confront resistance near the $67.00 mark ahead of the $67.30 horizontal zone. A sustained strength beyond the latter might trigger a short-covering rally towards the $68.00 mark, though is more likely to remain capped near the $68.40-$68.45 region. The latter should act as a pivotal point, which if cleared could allow Crude Oil prices to reclaim the $69.00 mark and climb further toward the $70.00 psychological mark.
WTI daily chart
(This story was corrected on October 1 at 10:14 GMT to say that WTI could climb further toward the $70.00 psychological mark, not $7.000.)
WTI Oil FAQs
WTI Oil is a type of Crude Oil sold on international markets. The WTI stands for West Texas Intermediate, one of three major types including Brent and Dubai Crude. WTI is also referred to as “light” and “sweet” because of its relatively low gravity and sulfur content respectively. It is considered a high quality Oil that is easily refined. It is sourced in the United States and distributed via the Cushing hub, which is considered “The Pipeline Crossroads of the World”. It is a benchmark for the Oil market and WTI price is frequently quoted in the media.
Like all assets, supply and demand are the key drivers of WTI Oil price. As such, global growth can be a driver of increased demand and vice versa for weak global growth. Political instability, wars, and sanctions can disrupt supply and impact prices. The decisions of OPEC, a group of major Oil-producing countries, is another key driver of price. The value of the US Dollar influences the price of WTI Crude Oil, since Oil is predominantly traded in US Dollars, thus a weaker US Dollar can make Oil more affordable and vice versa.
The weekly Oil inventory reports published by the American Petroleum Institute (API) and the Energy Information Agency (EIA) impact the price of WTI Oil. Changes in inventories reflect fluctuating supply and demand. If the data shows a drop in inventories it can indicate increased demand, pushing up Oil price. Higher inventories can reflect increased supply, pushing down prices. API’s report is published every Tuesday and EIA’s the day after. Their results are usually similar, falling within 1% of each other 75% of the time. The EIA data is considered more reliable, since it is a government agency.
OPEC (Organization of the Petroleum Exporting Countries) is a group of 12 Oil-producing nations who collectively decide production quotas for member countries at twice-yearly meetings. Their decisions often impact WTI Oil prices. When OPEC decides to lower quotas, it can tighten supply, pushing up Oil prices. When OPEC increases production, it has the opposite effect. OPEC+ refers to an expanded group that includes ten extra non-OPEC members, the most notable of which is Russia.
Author

Haresh Menghani
FXStreet
Haresh Menghani is a detail-oriented professional with 10+ years of extensive experience in analysing the global financial markets.


