WTI Price Analysis: Struggles below $74.00, seems vulnerable to slide further
- WTI drifts into negative territory for the fourth straight day on Tuesday.
- Demand concerns weigh on the commodity amid a notable USD demand.
- The worsening Middle East crisis might help limit losses for the black liquid.

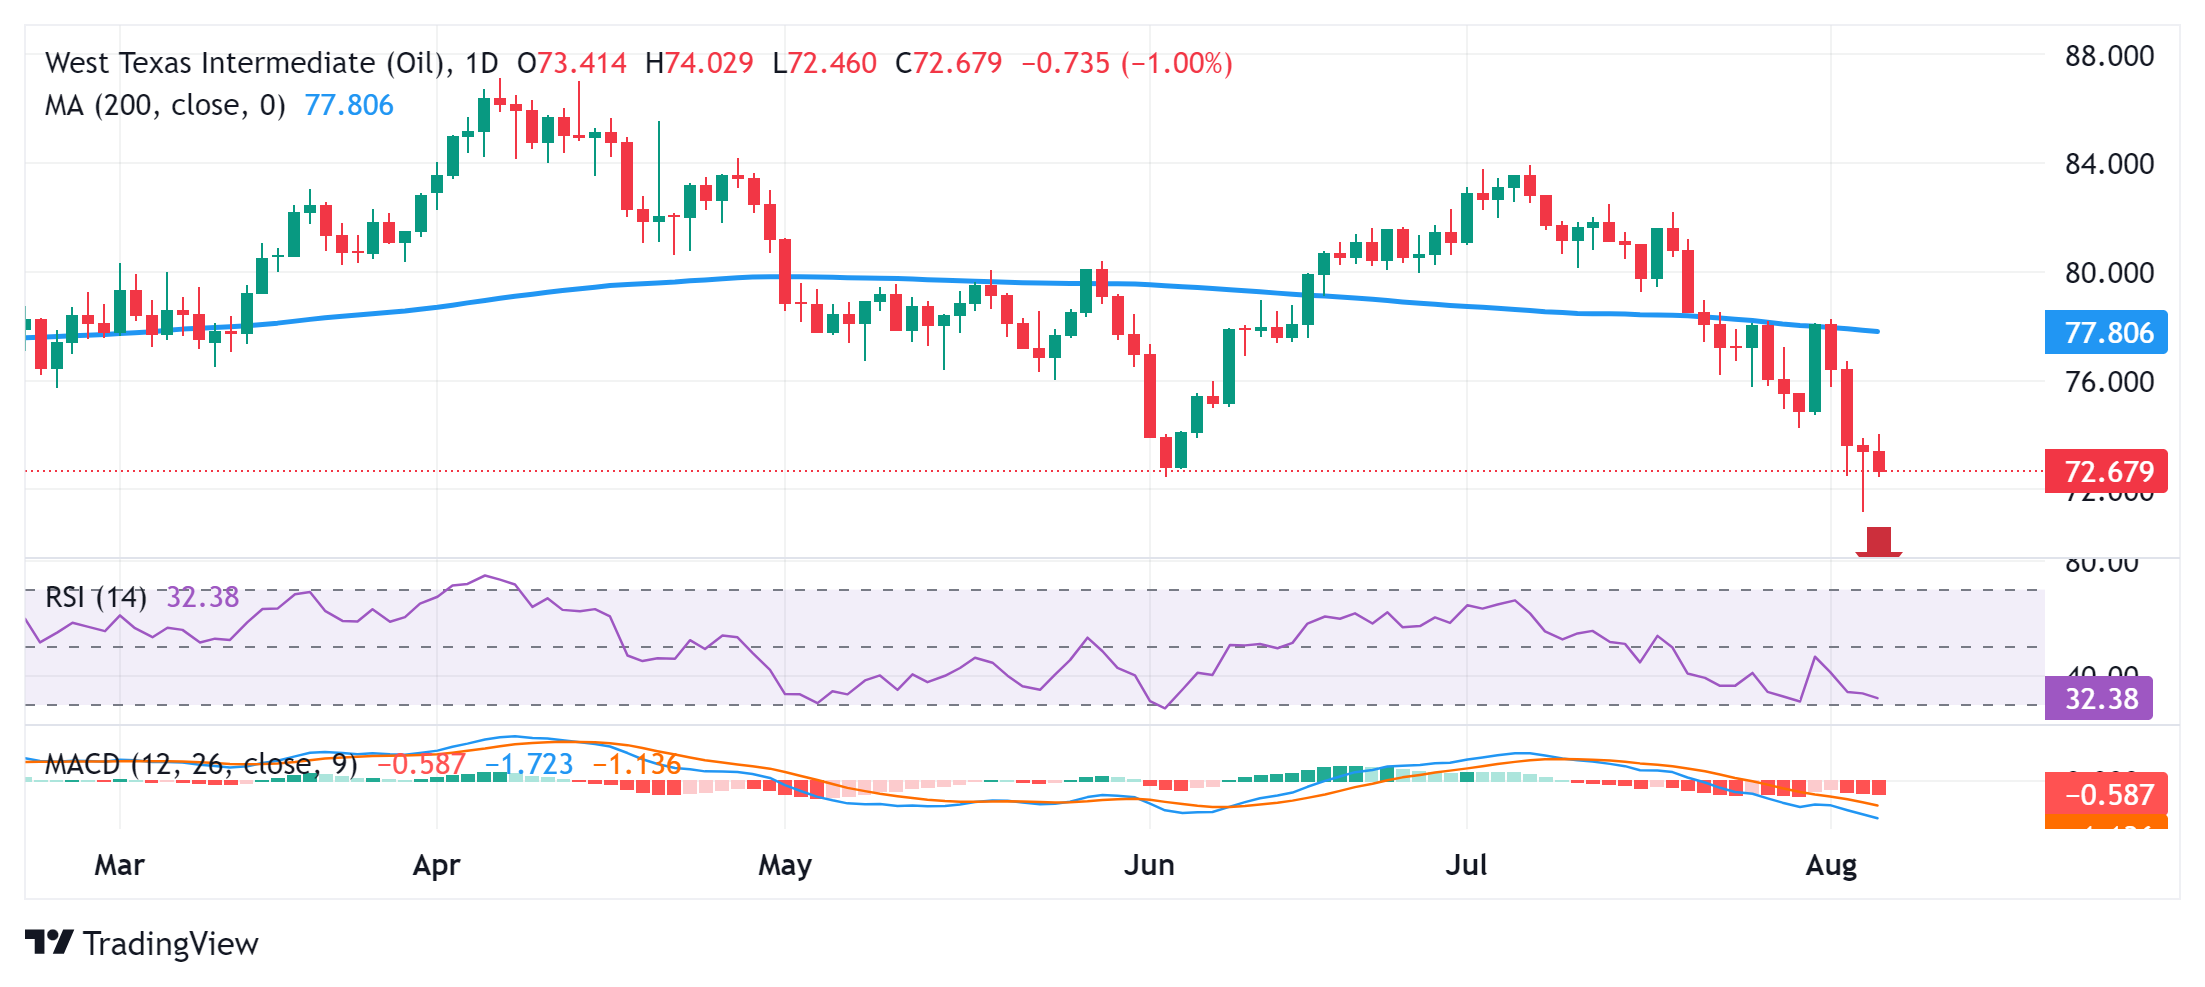
West Texas Intermediate (WTI) US crude Oil prices attract fresh sellers following an intraday uptick to the $74.00/barrel mark and turn lower for the fourth successive day on Tuesday. The commodity trades around the mid-$72.00s during the early part of the European session, albeit manages to hold above its lowest level since January 17 touched on Monday.
Concerns about an economic downturn in the US and China – the world's two largest economies – continue to act as a headwind for Crude Oil prices. Adding to this, the emergence of some US Dollar (USD) buying – bolstered by a bound in the US Treasury bond yields – exerts additional pressure on the USD-denominated commodity. That said, concerns about supply disruptions from the Middle East, amid the risk of a broader conflict in the key Oil producing region, could help limit losses for the black liquid.
From a technical perspective, the recent breakdown through and repeated failures near the very important 200-day Simple Moving Average (SMA) favours bearish traders. Moreover, oscillators on the daily chart have been gaining negative traction and are still away from being in the oversold territory. This, in turn, suggests that the path of least resistance for Crude Oil prices is to the downside and supports prospects for an extension of the downward trajectory witnessed over the past month or so.
In the meantime, the $72.00 round figure is likely to protect the immediate downside ahead of the overnight swing low, around the $71.20-$71.15 region. Some follow-through selling below the $71.00 mark will reaffirm the negative bias and make Crude Oil prices vulnerable to accelerate the fall towards intermediate support near mid-$70.00s en route to the $70.00 psychological mark. The depreciating move could extend further towards the next relevant support near the $69.60-$69.50 horizontal zone.
On the flip side, any meaningful recovery attempt now seems to confront stiff resistance near the daily swing high, around the $74.00 mark. A sustained strength beyond might trigger a short-covering rally and lift Crude Oil prices to the $74.90-$75.00 region. The recovery momentum could extend further towards the next relevant hurdle near the $75.60 zone en route to the $76.00 round-figure mark. The latter should act as a key pivotal point for short-term traders and cap any further upside for the commodity.
WTI daily chart
WTI Oil FAQs
WTI Oil is a type of Crude Oil sold on international markets. The WTI stands for West Texas Intermediate, one of three major types including Brent and Dubai Crude. WTI is also referred to as “light” and “sweet” because of its relatively low gravity and sulfur content respectively. It is considered a high quality Oil that is easily refined. It is sourced in the United States and distributed via the Cushing hub, which is considered “The Pipeline Crossroads of the World”. It is a benchmark for the Oil market and WTI price is frequently quoted in the media.
Like all assets, supply and demand are the key drivers of WTI Oil price. As such, global growth can be a driver of increased demand and vice versa for weak global growth. Political instability, wars, and sanctions can disrupt supply and impact prices. The decisions of OPEC, a group of major Oil-producing countries, is another key driver of price. The value of the US Dollar influences the price of WTI Crude Oil, since Oil is predominantly traded in US Dollars, thus a weaker US Dollar can make Oil more affordable and vice versa.
The weekly Oil inventory reports published by the American Petroleum Institute (API) and the Energy Information Agency (EIA) impact the price of WTI Oil. Changes in inventories reflect fluctuating supply and demand. If the data shows a drop in inventories it can indicate increased demand, pushing up Oil price. Higher inventories can reflect increased supply, pushing down prices. API’s report is published every Tuesday and EIA’s the day after. Their results are usually similar, falling within 1% of each other 75% of the time. The EIA data is considered more reliable, since it is a government agency.
OPEC (Organization of the Petroleum Exporting Countries) is a group of 13 Oil-producing nations who collectively decide production quotas for member countries at twice-yearly meetings. Their decisions often impact WTI Oil prices. When OPEC decides to lower quotas, it can tighten supply, pushing up Oil prices. When OPEC increases production, it has the opposite effect. OPEC+ refers to an expanded group that includes ten extra non-OPEC members, the most notable of which is Russia.
Author

Haresh Menghani
FXStreet
Haresh Menghani is a detail-oriented professional with 10+ years of extensive experience in analysing the global financial markets.


