|

WTI Price Analysis: Respects Dragonfly Doji bullish candlestick to snap three-day downtrend

  • WTI remains mildly bid after consecutive three days of downbeat performance.
  • Bullish candlestick formation, sustained bounce off 21-DMA favor buyers.
  • Previous support line, 50-DMA challenges immediate upside ahead of the monthly high.

WTI crude oil prints the first daily gains in three despite making rounds between $78.50 and $79.00 during early Friday.

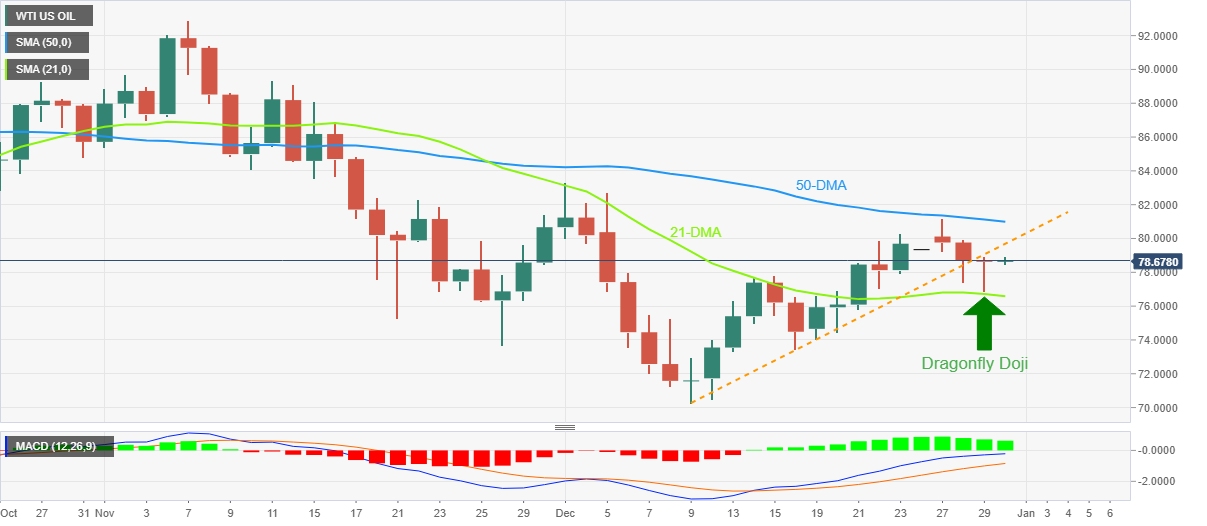
In doing so, the black gold respects the Dragonfly Doji bullish candlestick, marked the previous day, amid bullish MACD signals.

Also favoring the upside bias is the quote’s successful rebound from the 21-DMA, around $76.60 by the press time.

However, the support-turned-resistance line from early December, near $79.65 at the latest, precedes the $80.00 round figure to restrict the immediate upside of the energy benchmark.

Additionally challenging the WTI bulls is the 50-DMA hurdle surrounding $81.00 and the monthly peak of $83.30.

In a case where the commodity prices remain firmer past $83.30, the odds of witnessing a run-up toward the $90.00 threshold can’t be ruled out.

On the flip side, the sellers need validation from the 21-DMA support of $76.60 to aim for the mid-December lows surrounding $73.50.

If at all the crude oil price weakens below $73.50, the monthly low around $70.30 and the $70.00 psychological magnet will gain the market’s attention as a break of which could favor WTI bears to aim for late December 2021 bottom near $66.10.

WTI: Daily chart

Trend: Limited upside expected

additional important levels

Overview
Today last price78.75
Today Daily Change0.08
Today Daily Change %0.10%
Today daily open78.67
 
Trends
Daily SMA2076.48
Daily SMA5081.12
Daily SMA10083.82
Daily SMA20093.9
 
Levels
Previous Daily High78.93
Previous Daily Low76.86
Previous Weekly High80.29
Previous Weekly Low74.04
Previous Monthly High92.92
Previous Monthly Low73.66
Daily Fibonacci 38.2%77.65
Daily Fibonacci 61.8%78.14
Daily Pivot Point S177.38
Daily Pivot Point S276.08
Daily Pivot Point S375.31
Daily Pivot Point R179.44
Daily Pivot Point R280.22
Daily Pivot Point R381.51

Author

Anil Panchal

Anil Panchal

FXStreet

Anil Panchal has nearly 15 years of experience in tracking financial markets. With a keen interest in macroeconomics, Anil aptly tracks global news/updates and stays well-informed about the global financial moves and their implications.

More from Anil Panchal
Share:

Editor's Picks

EUR/USD remains offered below 1.1600, seems vulnerable near multi-month low

The EUR/USD pair struggles to capitalize on the overnight bounce from the 1.1530 region, or the lowest level since November 2025, and lower for the third consecutive day on Wednesday. Spot prices slide back below the 1.1600 mark during the Asian session and seem vulnerable to slide further.

GBP/USD slips below key averages as geopolitical risks mount

GBP/USD fell about 0.35% on Tuesday, settling around 1.3350 after slipping below the 200-day Exponential Moving Average for the first time since early December. The pair has pulled back sharply from its late-January high near 1.3870, shedding over 500 pips in a series of lower highs and lower lows. 

Gold rebounds ahead of US ADP, will it last?

Gold finds renewed Asian bids and retests $5,230 early Wednesday after the heavy sell-off on Tuesday. The US Dollar stands tall amid escalating Middle East tensions and reduced dovish Fed expectations. Gold defends $5,000 or 50% Fibo level after facing rejection at the 78.6% Fibo resistance at $5,342 amid bullish RSI.  

Ethereum: Whales step up buying as short positions contract

After holding firm heading into the last weekend, Ethereum whales have returned to action, pouncing on the volatility stemming from escalating military actions between the US and Iran.

Energy shock 2.0: Why rising Gas prices could hit the Euro

Even without a confirmed, sustained disruption, the mere risk to a key global energy chokepoint is enough to inject a significant premium into European Gas markets. And for the Euro, that matters.

Ripple falters amid sell-off jitters and negative funding rates

Ripple (XRP) has come under pressure, drifting lower to $1.35 at the time of writing on Tuesday. The over 2% correction looks poised to erase the previous day’s gains, which lifted the remittance token to $1.42.