|

WTI Price Analysis: Oil buyers stay hopeful beyond $77.80 despite pullback from 13-day-old resistance

  • WTI crude oil prints the first daily loss in three while retreating from short-term key resistance line.
  • Convergence of 200-day EMA, 50-day EMA puts a floor under the Oil Price.
  • Market’s cautious optimism also favors energy buyers despite mild losses.

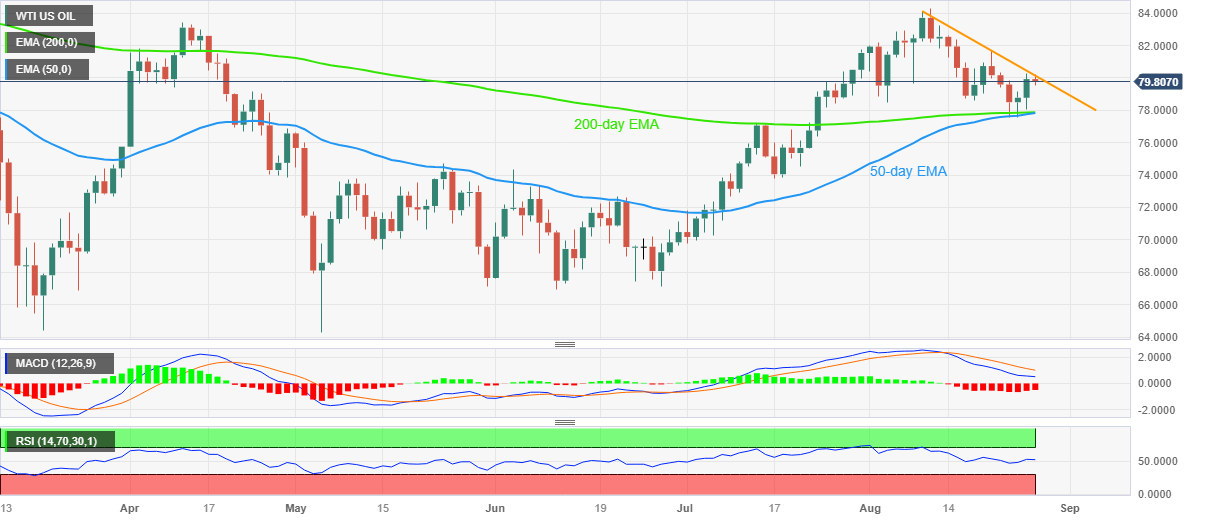
WTI crude oil remains mildly offered near $79.80 as it takes a U-turn from a two-week-old resistance line to print the first daily loss in three heading into Monday’s European session. In doing so, the Black Gold also justifies the bearish MACD signals while struggling to cheer the softer US Dollar, as well as China-inspired risk-on mood.

Also read: S&P 500 Futures, yields portray cautious optimism on China stimulus while preparing for US inflation, NFP

That said, a downward-sloping resistance line from August 09, around $80.15 by the press time, restricts the immediate upside of the energy benchmark.

Given the downbeat MACD signals and the latest retreat from the key resistance line, the Oil price may witness further pullback in the price.

However, a convergence of the 200-day and 50-day Exponential Moving Averages (EMA), around $77.80 at the latest, appears a tough nut to crack for the Oil bears.

Also acting as a short-term downside filter is the early July peak of around $77.15, a break of which will quickly drag the WTI crude oil price towards the high marked in May around d $74.70.

On the flip side, a daily closing beyond the stated resistance line, close to $80.15 will aim for the previous weekly high of around $81.70 before April’s top of $83.40.

In a case where the black gold remains firmer past $83.40, the current monthly high of around $84.35 will act as the last defense of the WTI sellers.

WTI Price: Daily chart

Trend: Limited downside expected

Additional important levels

Overview
Today last price79.76
Today Daily Change-0.17
Today Daily Change %-0.21
Today daily open79.93
 
Trends
Daily SMA2080.94
Daily SMA5076.58
Daily SMA10075.12
Daily SMA20075.96
 
Levels
Previous Daily High80.3
Previous Daily Low78.06
Previous Weekly High81.68
Previous Weekly Low77.53
Previous Monthly High81.78
Previous Monthly Low69.77
Daily Fibonacci 38.2%79.45
Daily Fibonacci 61.8%78.92
Daily Pivot Point S178.56
Daily Pivot Point S277.19
Daily Pivot Point S376.32
Daily Pivot Point R180.8
Daily Pivot Point R281.67
Daily Pivot Point R383.04

Author

Anil Panchal

Anil Panchal

FXStreet

Anil Panchal has nearly 15 years of experience in tracking financial markets. With a keen interest in macroeconomics, Anil aptly tracks global news/updates and stays well-informed about the global financial moves and their implications.

More from Anil Panchal
Share:

Markets move fast. We move first.

Orange Juice Newsletter brings you expert driven insights - not headlines. Every day on your inbox.

By subscribing you agree to our Terms and conditions.

Editor's Picks

EUR/USD moves sideways below 1.1800 on Christmas Eve

EUR/USD struggles to find direction and trades in a narrow channel below 1.1800 after posting gains for two consecutive days. Bond and stock markets in the US will open at the usual time and close early on Christmas Eve, allowing the trading action to remain subdued. 

GBP/USD keeps range around 1.3500 amid quiet markets

GBP/USD keeps its range trade intact at around 1.3500 on Wednesday. The Pound Sterling holds the upper hand over the US Dollar amid pre-Christmas light trading as traders move to the sidelines heading into the holiday season. 

Gold retreats from record highs, trades below $4,500

Gold retreats after setting a new record-high above $4,520 earlier in the day and trades in a tight range below $4,500 as trading volumes thin out ahead of the Christmas break. The US Dollar selling bias remains unabated on the back of dovish Fed expectations, which continues to act as a tailwind for the bullion amid persistent geopolitical risks.

Bitcoin slips below $87,000 as ETF outflows intensify, whale participation declines

Bitcoin price continues to trade around $86,770 on Wednesday, after failing to break above the $90,000 resistance. US-listed spot ETFs record an outflow of $188.64 million on Tuesday, marking the fourth consecutive day of withdrawals.

Economic outlook 2026-2027 in advanced countries: Solidity test

After a year marked by global economic resilience and ending on a note of optimism, 2026 looks promising and could be a year of solid economic performance. In our baseline scenario, we expect most of the supportive factors at work in 2025 to continue to play a role in 2026.

Avalanche struggles near $12 as Grayscale files updated form for ETF

Avalanche trades close to $12 by press time on Wednesday, extending the nearly 2% drop from the previous day. Grayscale filed an updated form to convert its Avalanche-focused Trust into an ETF with the US Securities and Exchange Commission.