WTI Price Analysis: Oil bears struggle to keep the reins, $78.00 is the key


  • WTI crude oil remains pressured at the lowest levels in 13 days, prints four-day downtrend.
  • 100-EMA, one-month-old ascending support line challenge energy bears.
  • Looming bear cross on MACD, RSI retreat keeps Oil sellers hopeful.
  • Oil price uptrend remains elusive below $83.30-40 resistance zone.

WTI crude oil renews a two-week low to around $78.30 as it drops for the fourth consecutive day heading into Thursday’s European session. In doing so, the energy benchmark prods the 100-day Exponential Moving Average (EMA) while also approaching an upward-sloping support line from March 20.

That said, the quote’s U-turn from $83.40, as well as a downward-sloping of the previous resistance line from early December 2022, keeps the Oil bears hopeful. Adding strength to the downside bias is the impending bear cross on the MACD and RSI (14) retreat.

Even so, the black gold needs to provide a clear downside break of the 100-day EMA and the one-month-old ascending trend line, respectively near $78.40 and $78.00, to convince the bears.

Following that, February’s low of $72.50 will gain the market’s attention, a break of which could recall the $70.00 psychological magnet to the chart.

On the flip side, the $80.00 round figure restricts the immediate upside of the Oil prices ahead of a downward-sloping-resistance line from the last December, near $81.50.

Following that, the WTI crude oil can change a horizontal area surrounding $83.30-40 that holds the key for the buyer’s conviction.

WTI: Daily chart

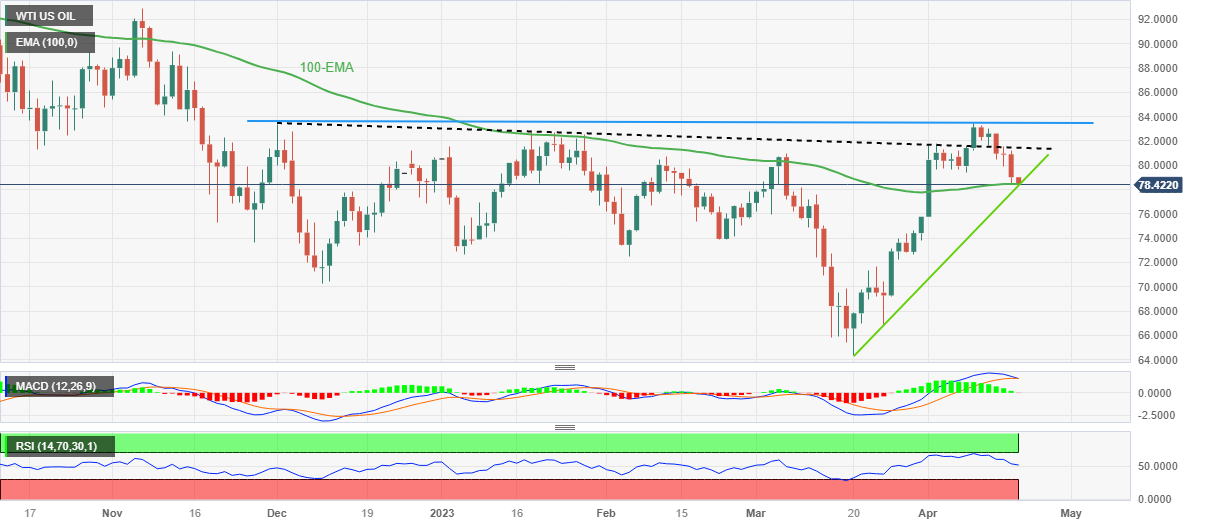
Trend: Further upside expected

Additional important levels

Overview
Today last price 78.4
Today Daily Change -0.60
Today Daily Change % -0.76%
Today daily open 79
 
Trends
Daily SMA20 77.54
Daily SMA50 76.44
Daily SMA100 77.01
Daily SMA200 82.31
 
Levels
Previous Daily High 81.21
Previous Daily Low 78.52
Previous Weekly High 83.4
Previous Weekly Low 79.4
Previous Monthly High 80.99
Previous Monthly Low 64.39
Daily Fibonacci 38.2% 79.55
Daily Fibonacci 61.8% 80.18
Daily Pivot Point S1 77.95
Daily Pivot Point S2 76.89
Daily Pivot Point S3 75.26
Daily Pivot Point R1 80.64
Daily Pivot Point R2 82.27
Daily Pivot Point R3 83.33


Share: Feed news

Information on these pages contains forward-looking statements that involve risks and uncertainties. Markets and instruments profiled on this page are for informational purposes only and should not in any way come across as a recommendation to buy or sell in these assets. You should do your own thorough research before making any investment decisions. FXStreet does not in any way guarantee that this information is free from mistakes, errors, or material misstatements. It also does not guarantee that this information is of a timely nature. Investing in Open Markets involves a great deal of risk, including the loss of all or a portion of your investment, as well as emotional distress. All risks, losses and costs associated with investing, including total loss of principal, are your responsibility. The views and opinions expressed in this article are those of the authors and do not necessarily reflect the official policy or position of FXStreet nor its advertisers. The author will not be held responsible for information that is found at the end of links posted on this page.

If not otherwise explicitly mentioned in the body of the article, at the time of writing, the author has no position in any stock mentioned in this article and no business relationship with any company mentioned. The author has not received compensation for writing this article, other than from FXStreet.

FXStreet and the author do not provide personalized recommendations. The author makes no representations as to the accuracy, completeness, or suitability of this information. FXStreet and the author will not be liable for any errors, omissions or any losses, injuries or damages arising from this information and its display or use. Errors and omissions excepted.

The author and FXStreet are not registered investment advisors and nothing in this article is intended to be investment advice.

Recommended content


Recommended content

Editors’ Picks

EUR/USD eases to daily lows near 1.0260

EUR/USD eases to daily lows near 1.0260

Better-than-expected results from the US docket on Friday lend wings to the US Dollar and spark a corrective decline in EUR/USD to the area of daily lows near 1.0260.

EUR/USD News
GBP/USD remains under pressure on strong Dollar, data

GBP/USD remains under pressure on strong Dollar, data

GBP/USD remains on track to close another week of losses on Friday, hovering around the 1.2190 zone against the backdrop of the bullish bias in the Greenback and poor results from the UK calendar.

GBP/USD News
Gold recedes from tops, retests $2,700

Gold recedes from tops, retests $2,700

The daily improvement in the Greenback motivates Gold prices to give away part of the weekly strong advance and slip back to the vicinity of the $2,700 region per troy ounce at the end of the week.

Gold News
Five keys to trading Trump 2.0 with Gold, Stocks and the US Dollar

Five keys to trading Trump 2.0 with Gold, Stocks and the US Dollar Premium

Donald Trump returns to the White House, which impacts the trading environment. An immediate impact on market reaction functions, tariff talk and regulation will be seen. Tax cuts and the fate of the Federal Reserve will be in the background.

Read more
Hedara bulls aim for all-time highs

Hedara bulls aim for all-time highs

Hedara’s price extends its gains, trading at $0.384 on Friday after rallying more than 38% this week. Hedara announces partnership with Vaultik and World Gemological Institute to tokenize $3 billion in diamonds and gemstones

Read more
Trusted Broker Reviews for Smarter Trading

Trusted Broker Reviews for Smarter Trading

VERIFIED Discover in-depth reviews of reliable brokers. Compare features like spreads, leverage, and platforms. Find the perfect fit for your trading style, from CFDs to Forex pairs like EUR/USD and Gold.

Read More

Forex MAJORS

Cryptocurrencies

Signatures