|

WTI Price Analysis: Jostles with 50-DMA to convince Oil buyers

  • WTI grinds higher after crossing one-week-old resistance line.
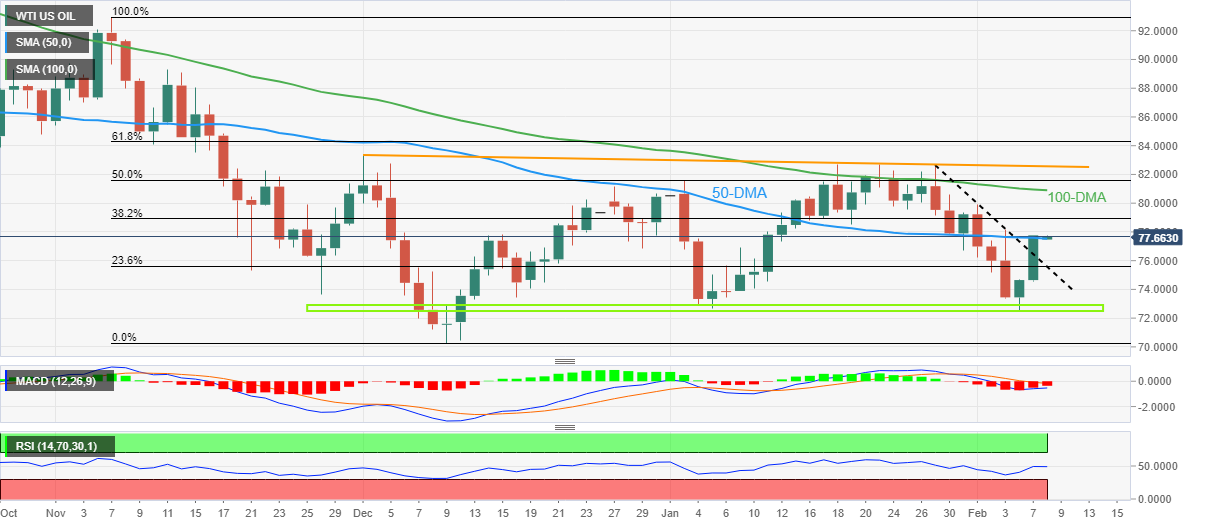
  • Unimpressive oscillators, 50-DMA challenges Oil bulls ahead of the key 100-DMA hurdle.
  • Pullback remains elusive below $75.60 support confluence, $73.00-72.50 region appears a tough nut to crack for bears.

WTI crude oil struggles to extend the previous day’s stellar run-up around the weekly top, making rounds to $77.70-60 during early Wednesday. In doing so, the black gold seesaws around the 50-DMA amid sluggish RSI (14) and MACD signals.

It’s worth noting, however, that Tuesday’s upside break of a one-week-long descending trend line keeps WTI bulls hopeful.

Hence, a clear upside break of the 50-DMA hurdle, currently around $77.80, appears necessary for the WTI bulls to keep the reins.

Even so, the 100-DMA and a two-month-old descending resistance line, respectively around $80.90 and $82.70, could challenge the Oil buyers before giving them control.

That said, the 61.8% Fibonacci retracement level of the commodity’s November-December 2023 downturn near $84.30, also known as the “Golden Ratio”, acts as the last defense of the Oil bears.

Meanwhile, the resistance-turned-support line joins the 23.6% Fibonacci retracement to highlight $75.60 as the key support confluence for WTI bears to watch for taking entries.

Following that, a horizontal area comprising multiple levels marked since early December 2022, near $73.00-72.50, will be crucial as a break of which can quickly drag the prices toward late 2022 low near $70.30.

Overall, Oil buyers need to wait for a clear sign but the bears are clearly off the table.

WTI: Daily chart

Trend: Sideways

Additional important levels

Overview
Today last price77.67
Today Daily Change3.02
Today Daily Change %4.05%
Today daily open74.65
 
Trends
Daily SMA2078.79
Daily SMA5077.61
Daily SMA10081.01
Daily SMA20090.63
 
Levels
Previous Daily High74.68
Previous Daily Low72.5
Previous Weekly High80.61
Previous Weekly Low73.36
Previous Monthly High82.68
Previous Monthly Low72.64
Daily Fibonacci 38.2%73.85
Daily Fibonacci 61.8%73.34
Daily Pivot Point S173.21
Daily Pivot Point S271.77
Daily Pivot Point S371.03
Daily Pivot Point R175.39
Daily Pivot Point R276.13
Daily Pivot Point R377.57

Author

Anil Panchal

Anil Panchal

FXStreet

Anil Panchal has nearly 15 years of experience in tracking financial markets. With a keen interest in macroeconomics, Anil aptly tracks global news/updates and stays well-informed about the global financial moves and their implications.

More from Anil Panchal
Share:

Markets move fast. We move first.

Orange Juice Newsletter brings you expert driven insights - not headlines. Every day on your inbox.

By subscribing you agree to our Terms and conditions.

Editor's Picks

EUR/USD moves sideways below 1.1800 on Christmas Eve

EUR/USD struggles to find direction and trades in a narrow channel below 1.1800 after posting gains for two consecutive days. Bond and stock markets in the US will open at the usual time and close early on Christmas Eve, allowing the trading action to remain subdued. 

GBP/USD keeps range around 1.3500 amid quiet markets

GBP/USD keeps its range trade intact at around 1.3500 on Wednesday. The Pound Sterling holds the upper hand over the US Dollar amid pre-Christmas light trading as traders move to the sidelines heading into the holiday season. 

Gold retreats from record highs, trades below $4,500

Gold retreats after setting a new record-high above $4,520 earlier in the day and trades in a tight range below $4,500 as trading volumes thin out ahead of the Christmas break. The US Dollar selling bias remains unabated on the back of dovish Fed expectations, which continues to act as a tailwind for the bullion amid persistent geopolitical risks.

Bitcoin slips below $87,000 as ETF outflows intensify, whale participation declines

Bitcoin price continues to trade around $86,770 on Wednesday, after failing to break above the $90,000 resistance. US-listed spot ETFs record an outflow of $188.64 million on Tuesday, marking the fourth consecutive day of withdrawals.

Economic outlook 2026-2027 in advanced countries: Solidity test

After a year marked by global economic resilience and ending on a note of optimism, 2026 looks promising and could be a year of solid economic performance. In our baseline scenario, we expect most of the supportive factors at work in 2025 to continue to play a role in 2026.

Avalanche struggles near $12 as Grayscale files updated form for ETF

Avalanche trades close to $12 by press time on Wednesday, extending the nearly 2% drop from the previous day. Grayscale filed an updated form to convert its Avalanche-focused Trust into an ETF with the US Securities and Exchange Commission.