WTI Price Analysis: Bulls pile it on in $75.00 target area, focus is on Asian highs guarding $77.70


  • WTI dropped to the %75s and now the daily chart shows the price breaking the trendline support.
  • WTI, however, is now correcting higher to $76.70 resistance.
  • The $77.70s are eyed as a 61.8% ratio target.

As per the prior analysis of the week, targetting the $75s target area, the objective was reached in the New york equities cash opening window with heightened volatility. The focus is now on the upside as the bulls move in for the kill to sweep the buy liquidity with a focus on the Asian highs that guard the price imbalances above. Targets are placed around $77.50 (50% mean reversion area), $77.70 (Mondayinitial balance lows) and a 61.8% Fibonacci retracement of the latest bearish impulse around $78.80 as the following analysis illustrates. 

WTI, prior analysis 

 WTI bears taking control into the Fed, eyes on $75.00bbl

 WTI Price Analysis: Bears break key hourly structure, eye $75.00bbls

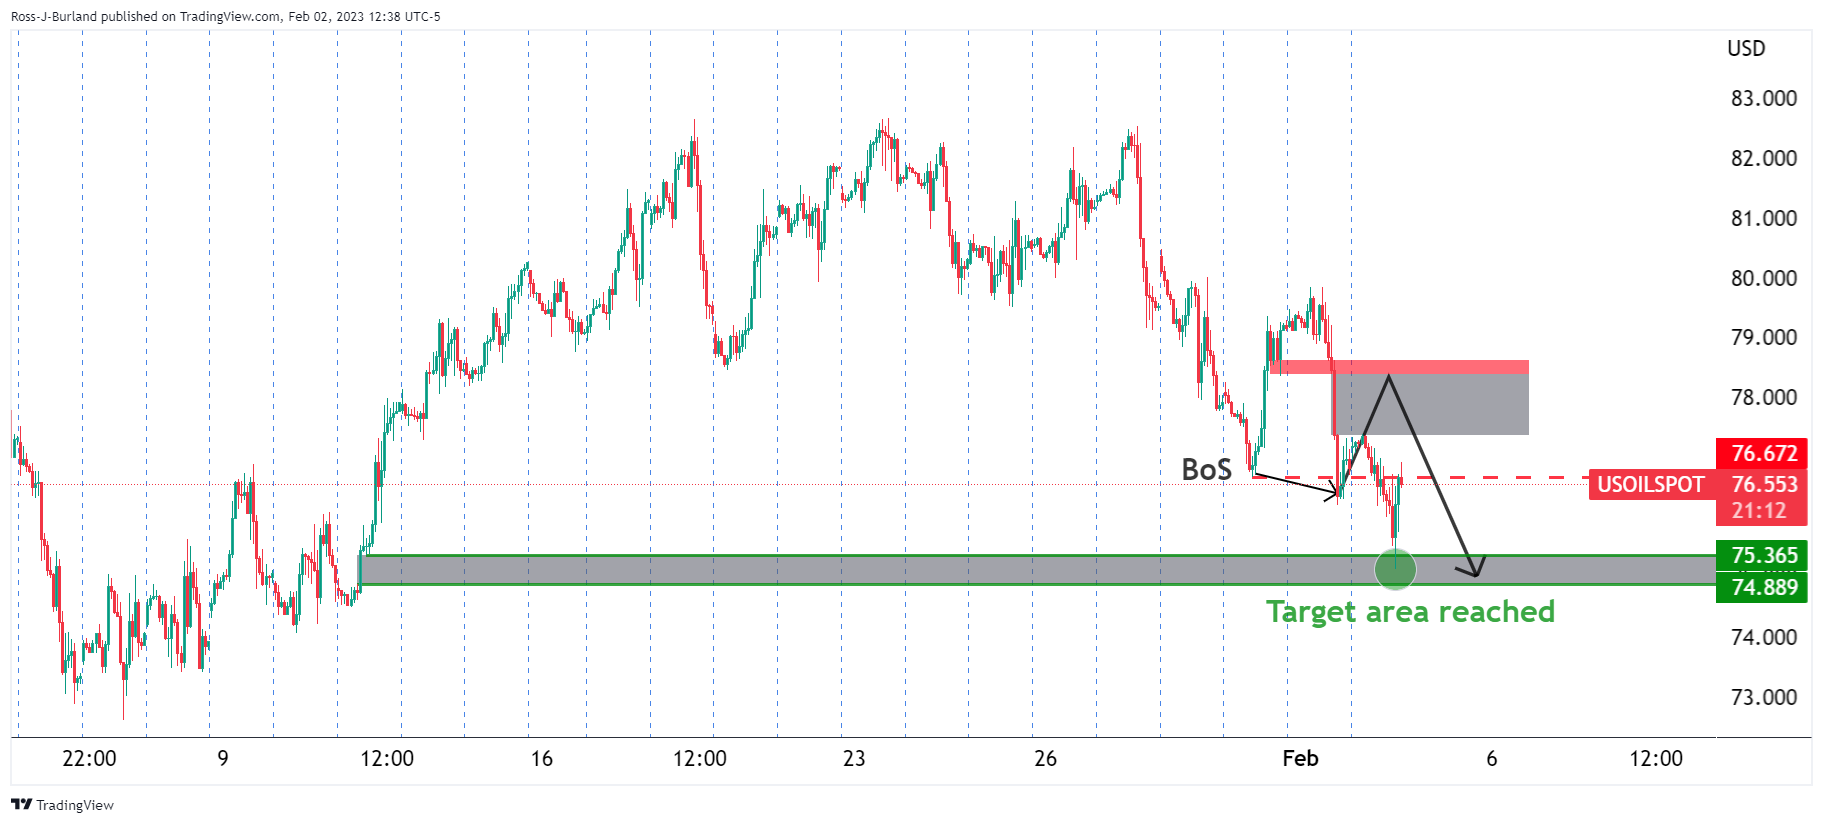
It was suggested that ''a correction into resistance could entice trapped longs to get out of losing or breakeven positions and subsequently the shorts coming onto the market around 38.2% Fibonacci correction could see a move out of the consolidation below the trapped volume and into a 100% measured target towards $75.00 over the course of the coming week.''

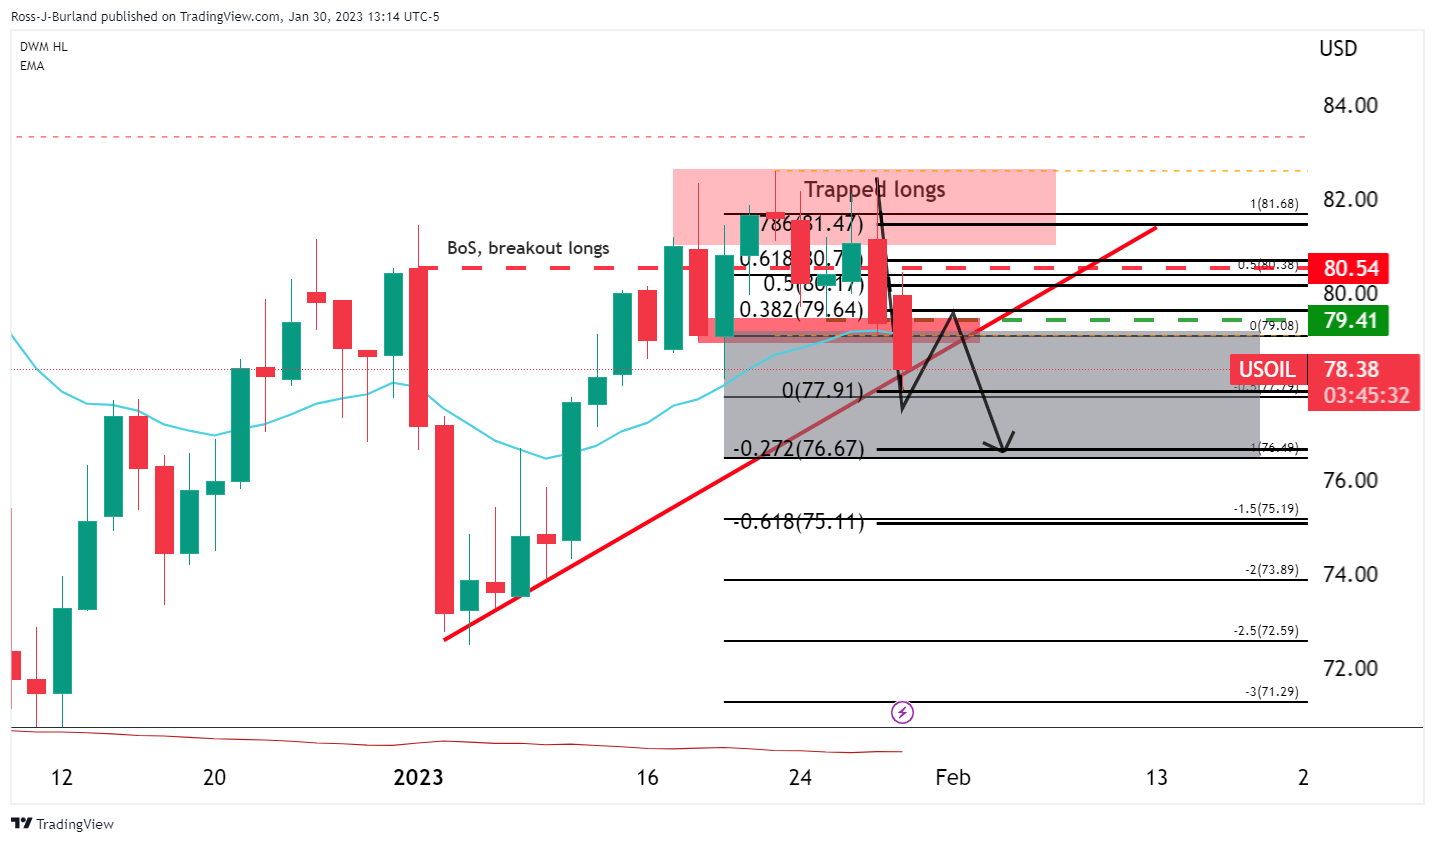
As illustrated, the price sank into the target area following a correction into where shorts were looking to get in at a premium. The subsequent move had fulfilled the 100% measured move and $75.00 was beckoning:

WTI H1 charts, prior analysis
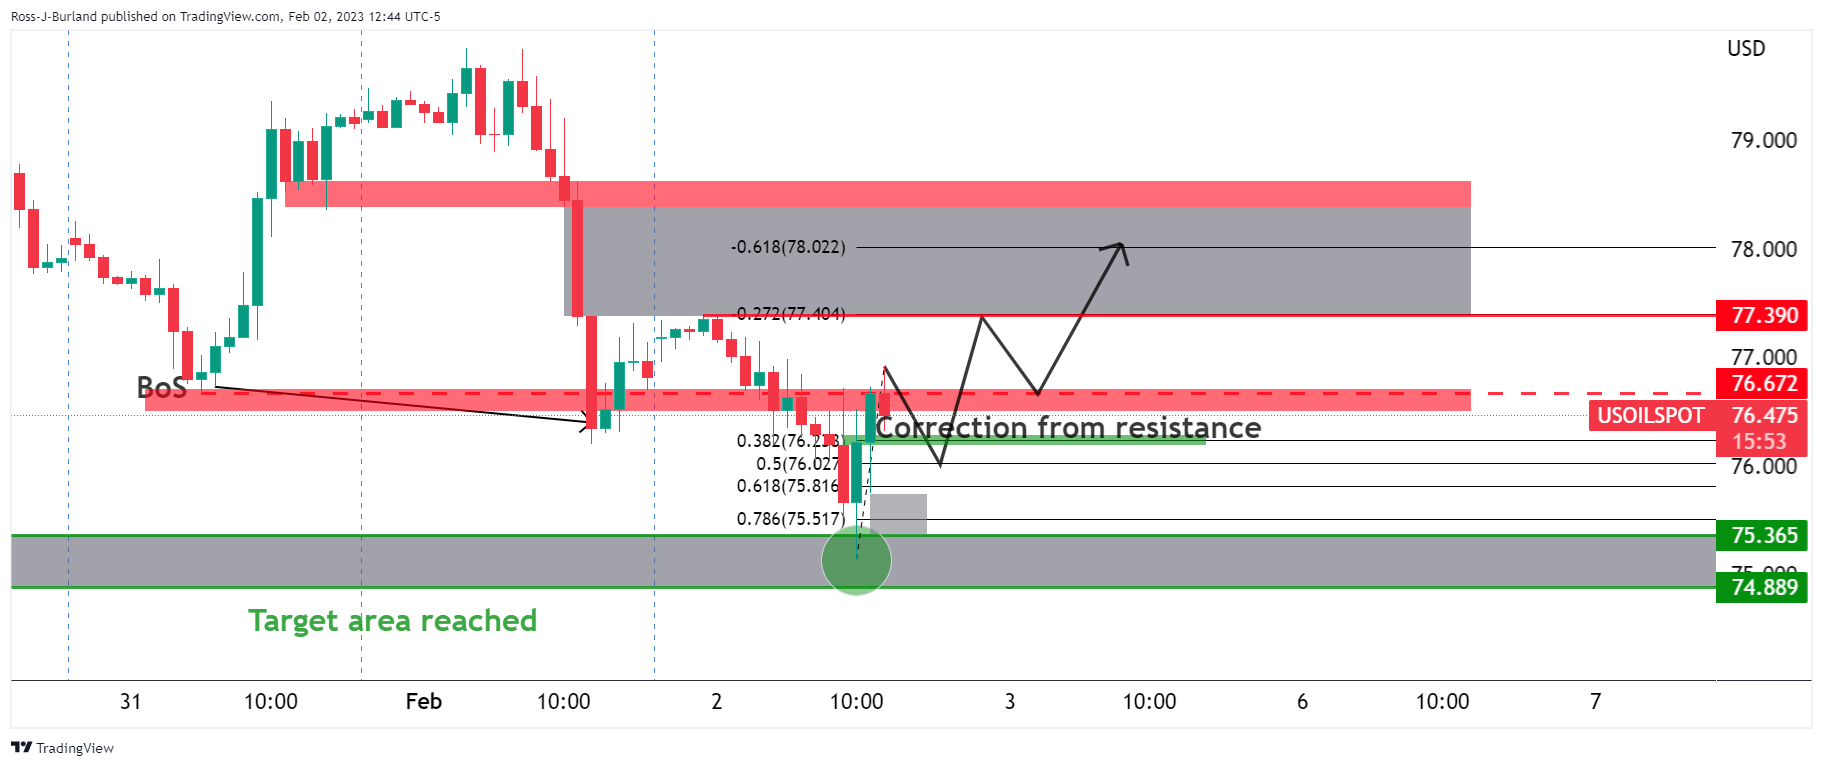
Zoomed in ...

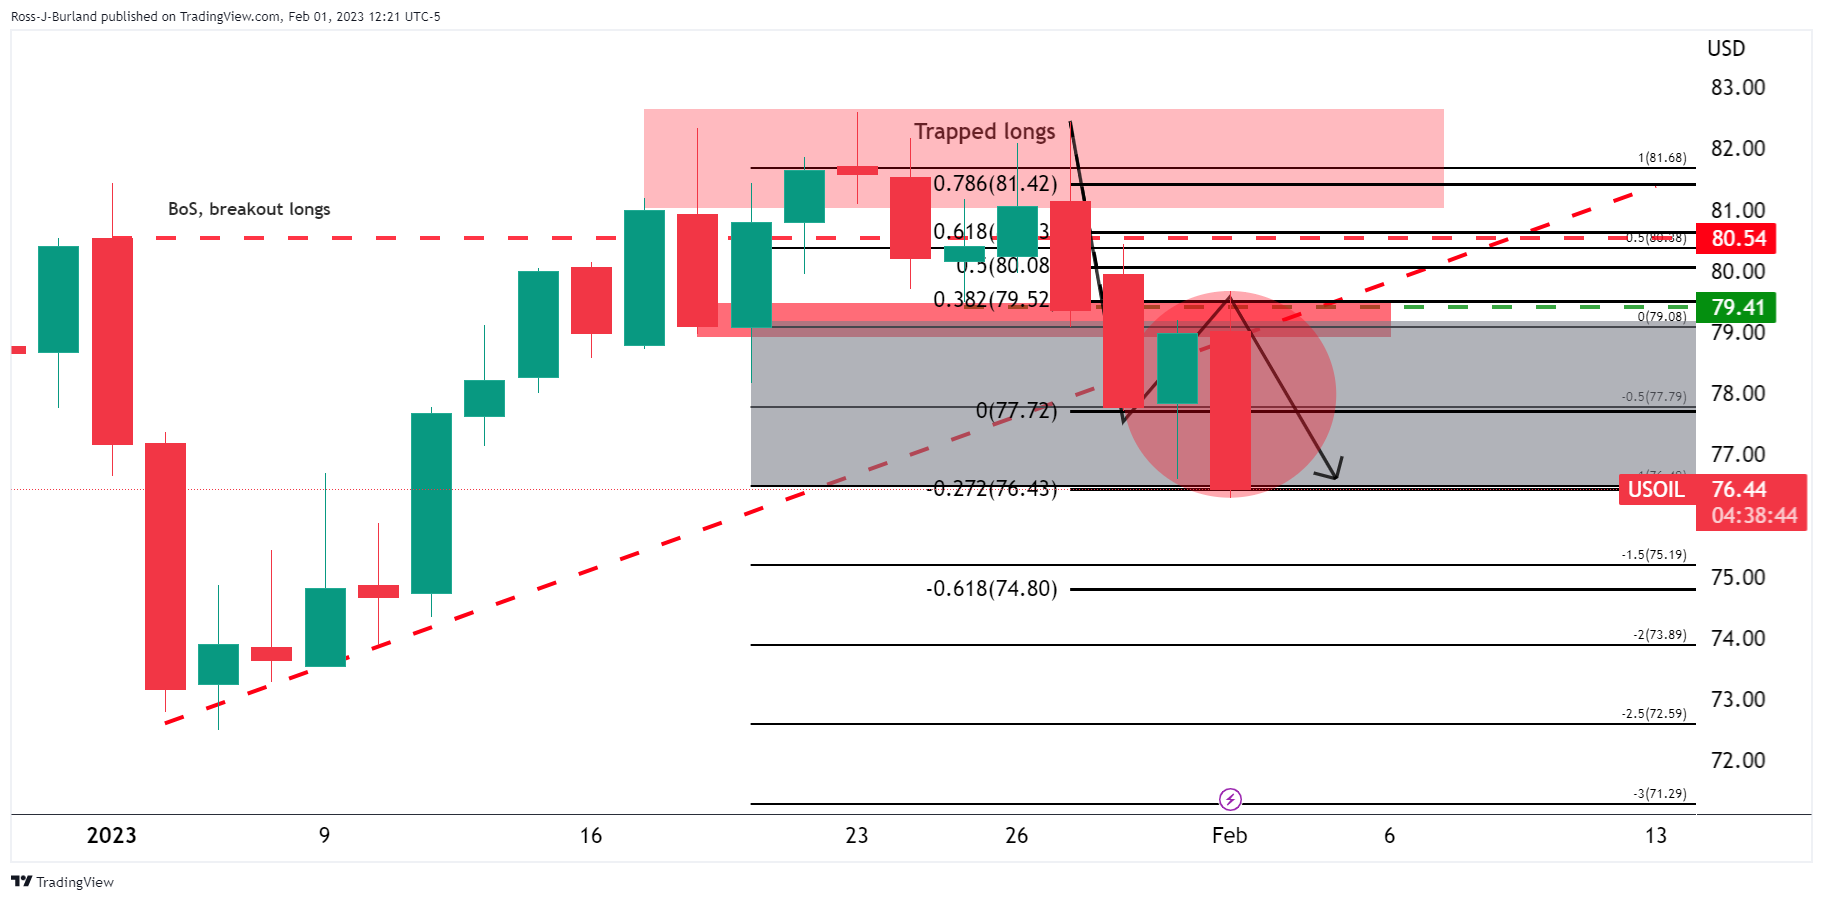
The greyed areas were price imbalances while the red marking was a resistance zone that had a confluence with the 61.8% Fibonacci retracement level near $78.50. While below there, the bias was to the downside.

However, a more shallow correction may be all that was needed. Either way, bears were looking to target between $75.36 and $74.88 on a break of $75.50. 

WTI Update

The price has reached the resistance and a correction is underway. 

WTI daily and M15 charts

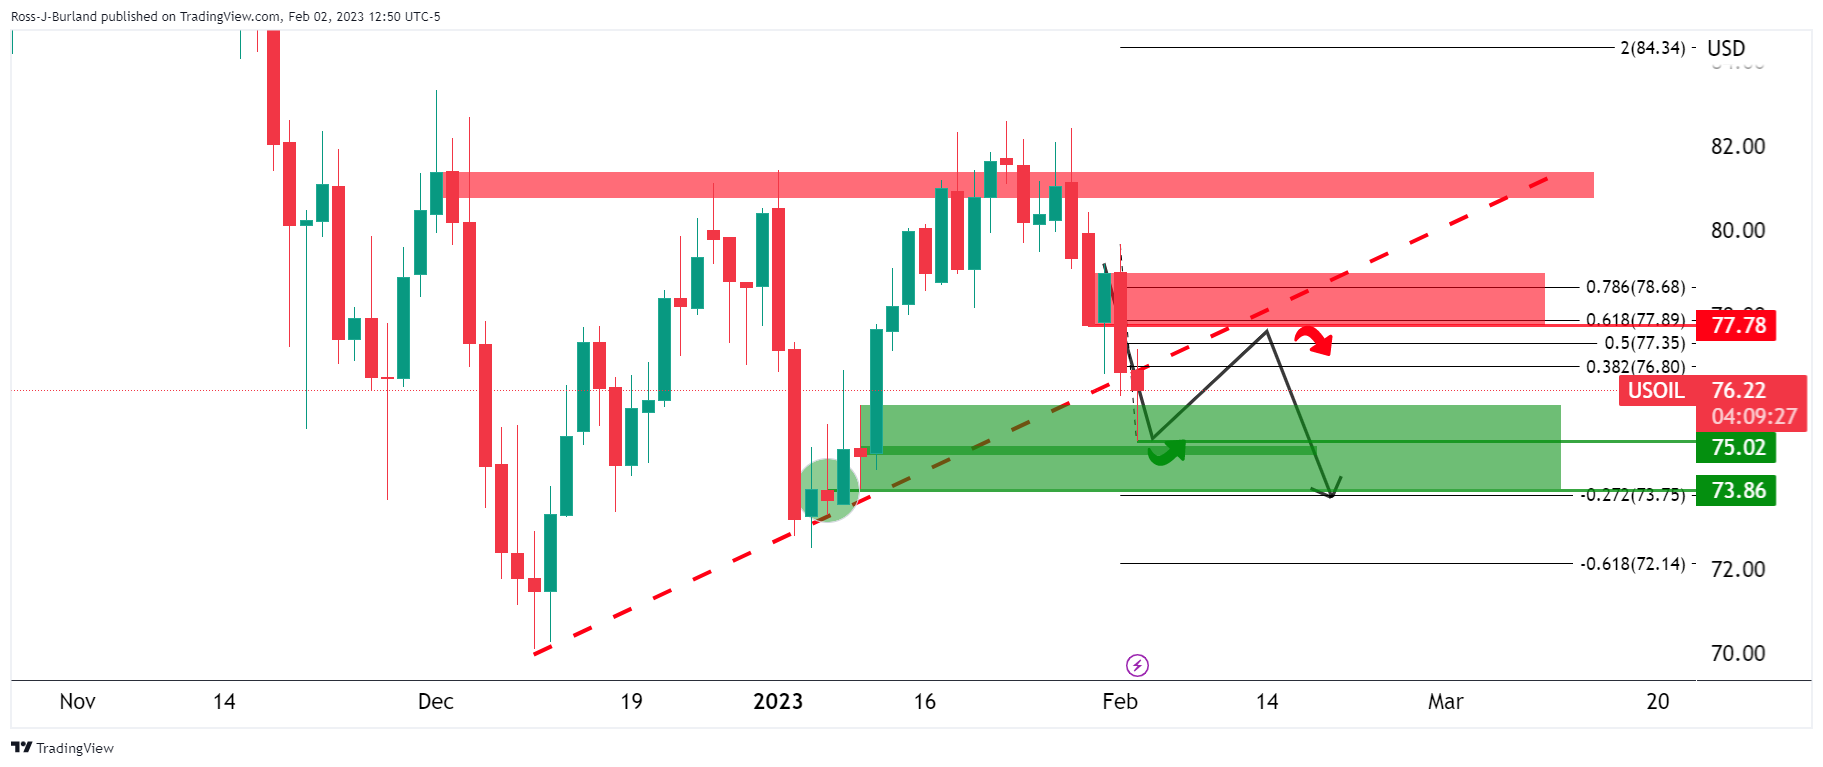
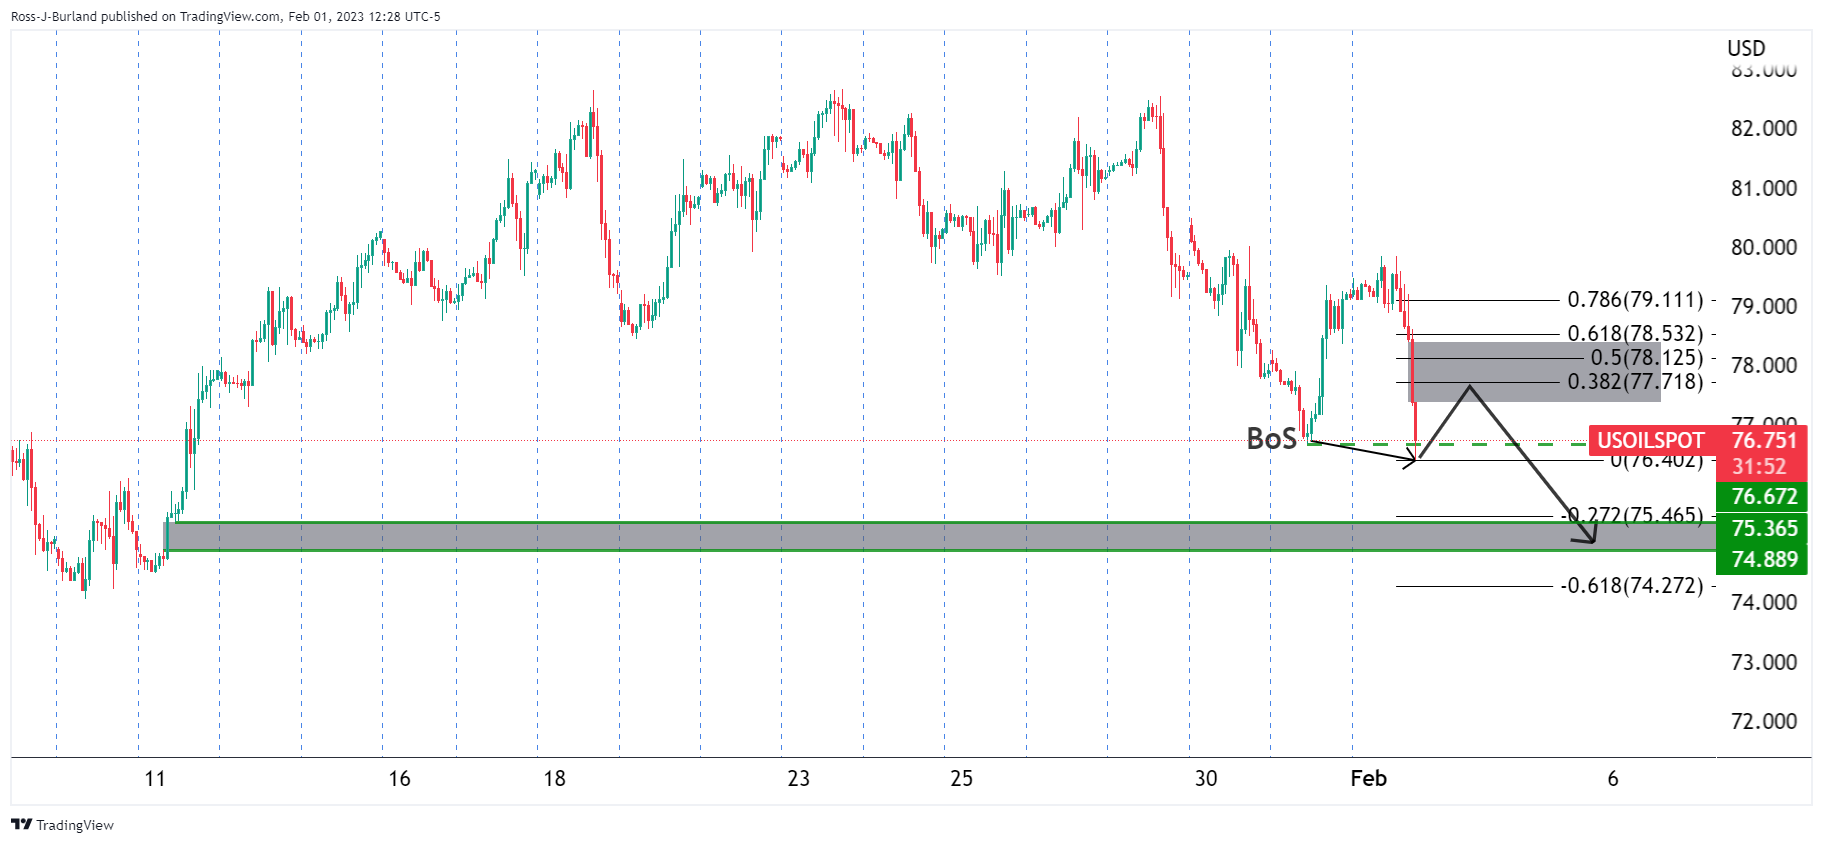
The daily chart shows the price breaking the trendline support but meeting horizontal support and correcting. If this is the start of a daily correction, then the $77.70s are eyed in a 61.8% ratio of the bearish impulse. 

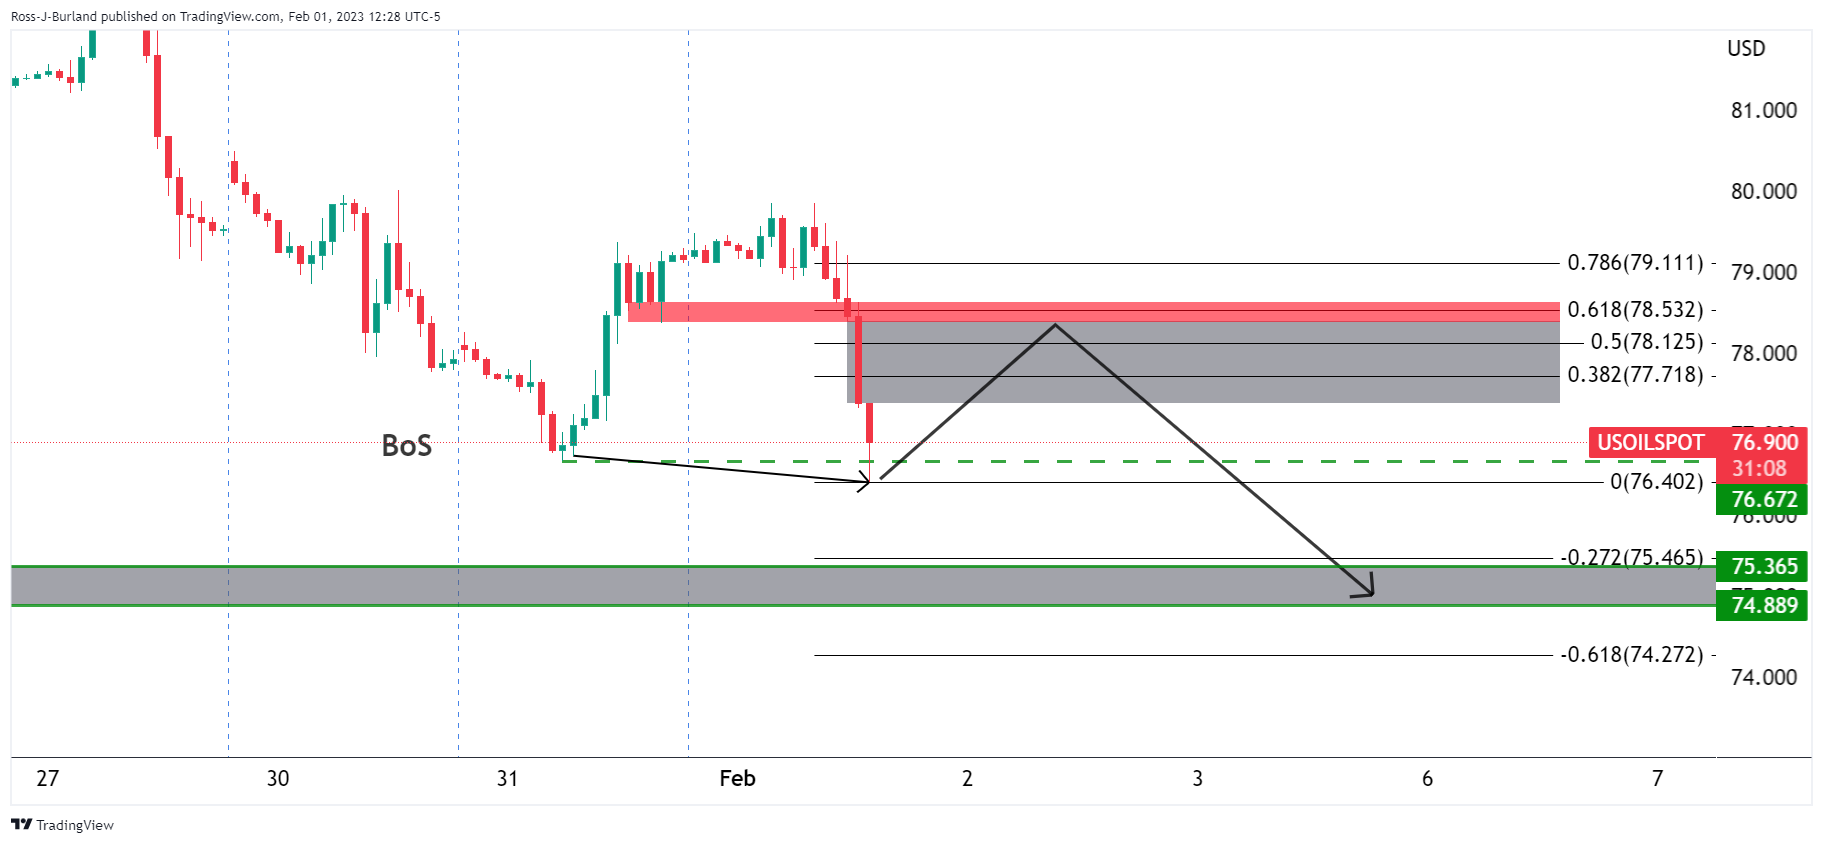
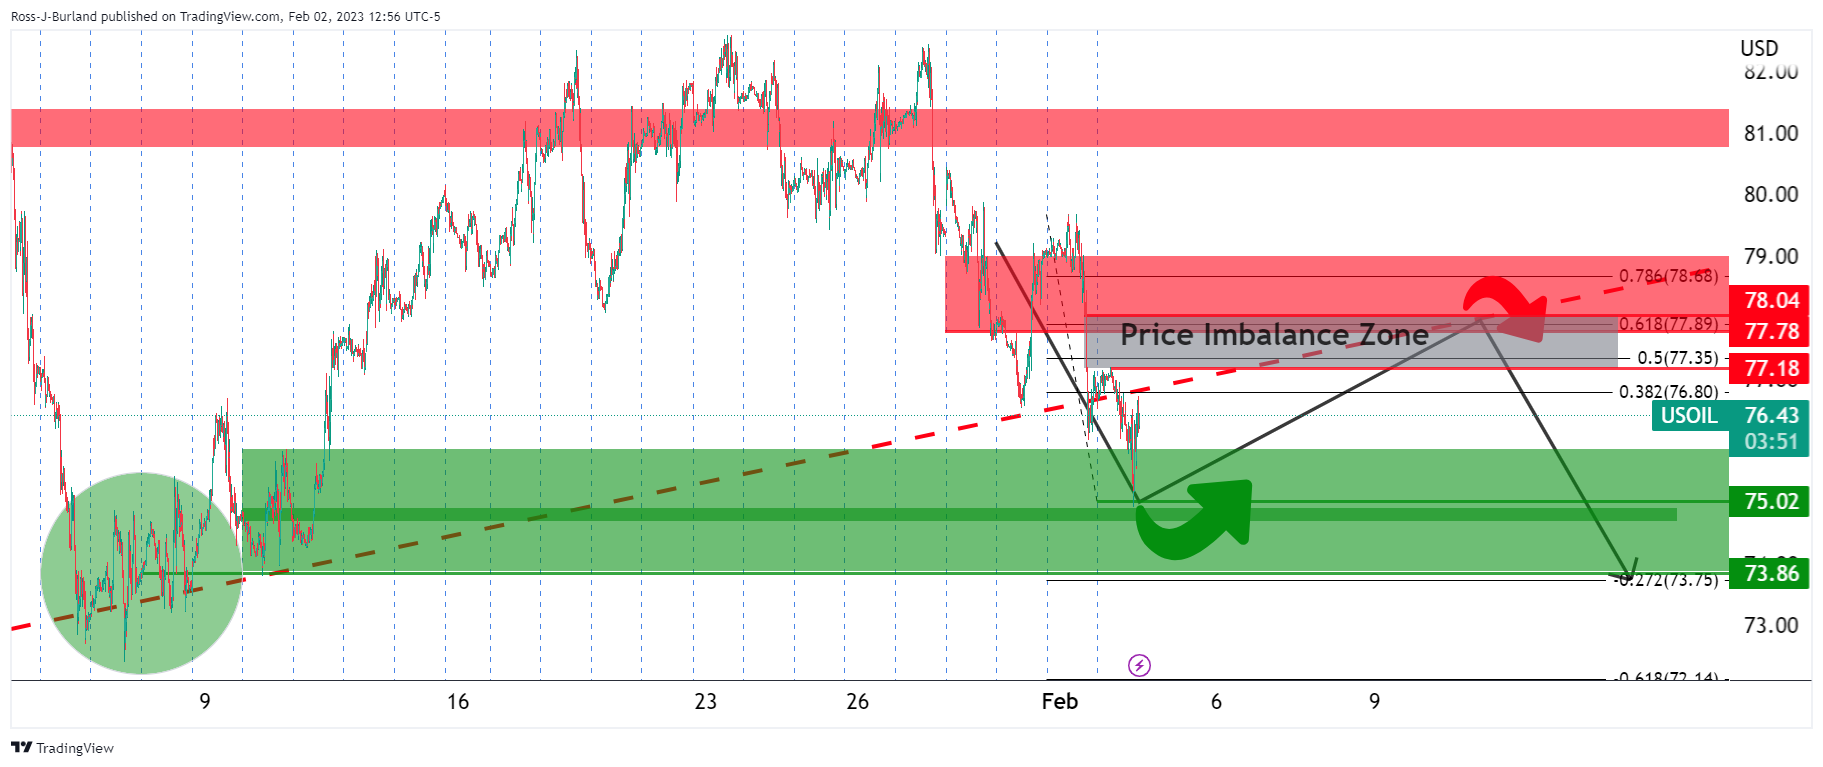
Moving down to the 15-minute chart we can see a price imbalance between $77.18 and $78.04 for the bulls to target:

Share: Feed news

Information on these pages contains forward-looking statements that involve risks and uncertainties. Markets and instruments profiled on this page are for informational purposes only and should not in any way come across as a recommendation to buy or sell in these assets. You should do your own thorough research before making any investment decisions. FXStreet does not in any way guarantee that this information is free from mistakes, errors, or material misstatements. It also does not guarantee that this information is of a timely nature. Investing in Open Markets involves a great deal of risk, including the loss of all or a portion of your investment, as well as emotional distress. All risks, losses and costs associated with investing, including total loss of principal, are your responsibility. The views and opinions expressed in this article are those of the authors and do not necessarily reflect the official policy or position of FXStreet nor its advertisers. The author will not be held responsible for information that is found at the end of links posted on this page.

If not otherwise explicitly mentioned in the body of the article, at the time of writing, the author has no position in any stock mentioned in this article and no business relationship with any company mentioned. The author has not received compensation for writing this article, other than from FXStreet.

FXStreet and the author do not provide personalized recommendations. The author makes no representations as to the accuracy, completeness, or suitability of this information. FXStreet and the author will not be liable for any errors, omissions or any losses, injuries or damages arising from this information and its display or use. Errors and omissions excepted.

The author and FXStreet are not registered investment advisors and nothing in this article is intended to be investment advice.

Recommended content


Recommended content

Editors’ Picks

GBP/USD extends recovery gains to near 1.3250, as BoE looms

GBP/USD extends recovery gains to near 1.3250, as BoE looms

GBP/USD extends the recovery to near 1.3200 in European trading on Thursday, having found buyers near 1.3150. A fresh US Dollar pullback and a rebound in risk sentiment offer support to the pair ahead of the BoE policy announcements. 

GBP/USD News
EUR/USD advances to 1.1150, focus shifts to ECB-speak

EUR/USD advances to 1.1150, focus shifts to ECB-speak

EUR/USD is well-bid near 1.1150 in the European session on Thursday. The pair is underpinned by the renewed US Dollar retreat and an upbeat mood. Traders digest the Fed's dovish outlook, bracing for ECB-speak for fresh trading incentives. US data are also eyed. 

EUR/USD News
Gold price jumps back closer to all-time peak, $2,600 remains in sight amid fresh USD weakness

Gold price jumps back closer to all-time peak, $2,600 remains in sight amid fresh USD weakness

Gold price regains positive traction following the previous day's pullback from the all-time peak and builds on its steady intraday ascent heading into the European session on Thursday. 

Gold News
BoE expected to keep interest rate unchanged at 5% as price pressures persist

BoE expected to keep interest rate unchanged at 5% as price pressures persist

After a close call in August, the Bank of England’s September interest rate decision is keenly awaited for fresh cues on the bank’s future policy action and the pace of its bond sales.

Read more
Bitcoin surges to $62,000 mark after 50 bps Fed rate cut

Bitcoin surges to $62,000 mark after 50 bps Fed rate cut

Bitcoin and Ripple eye for a rally as they break and find support around their resistance barrier. Meanwhile, Ethereum demonstrates signs of recovery as it approaches a critical resistance level, indicating that an upward rally could be on the horizon if it successfully breaks through.

Read more
Moneta Markets review 2024: All you need to know

Moneta Markets review 2024: All you need to know

VERIFIED In this review, the FXStreet team provides an independent and thorough analysis based on direct testing and real experiences with Moneta Markets – an excellent broker for novice to intermediate forex traders who want to broaden their knowledge base.

Read More

Forex MAJORS

Cryptocurrencies

Signatures