- WTI bulls take a breather around monthly top after running the most in six weeks.
- Bullish MACD signals, clear break of the key DMAs favor buyers.
- Previous resistance line adds to the downside filters.
- 38.2% Fibonacci retracement level, late July peak lure buyers.
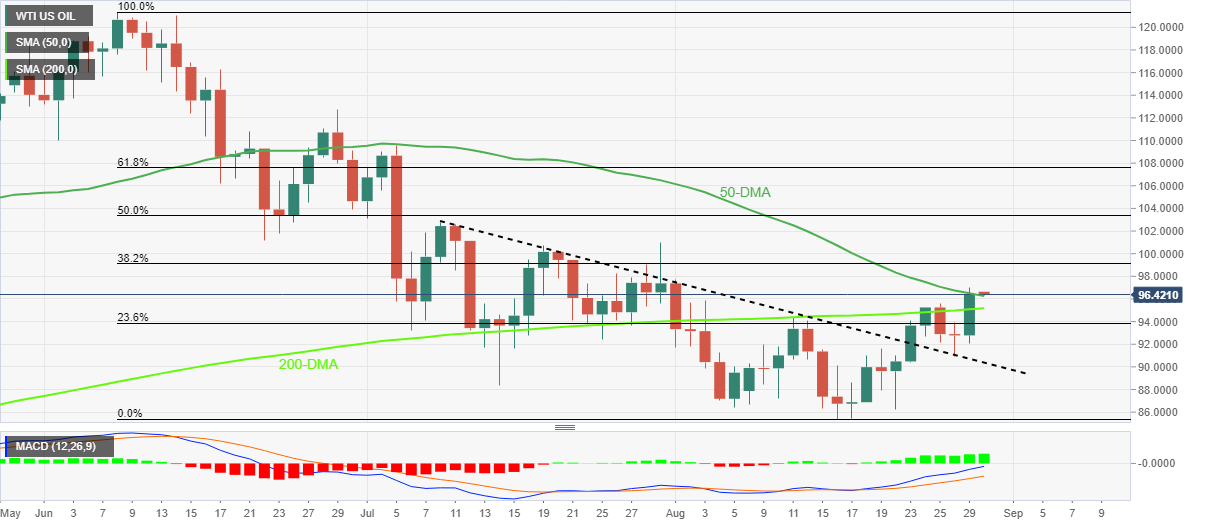
WTI crude oil prices remain sidelined at around $96.50, after rising the most in 1.5 months the previous day. In doing so, the black gold seesaws around the monthly high while keeping the previous day’s upside break of the 50-DMA and the 200-DMA.
The upside bias also takes clues from the bullish MACD signals and the quote’s ability to rebound from the resistance-turned-support line from early July on Friday.
That said, the 38.2% Fibonacci retracement of the energy benchmark’s downtrend from June, near $99.10, seems to lure the intraday buyers ahead of the $100.00 threshold.
However, late July’s swing high around $101.00 and the 50% Fibonacci retracement level of $103.35 could challenge the WTI buyers afterward.
On the contrary, the 50-DMA support of $96.20 could challenge the immediate pullback moves ahead of the 200-DMA, close to $95.15 at the latest.
Following that, the previous resistance line from July 08, near $90.30 at the latest, will be important to watch for the WTI bear’s entry.
WTI: Daily chart
Trend: Further upside expected
Information on these pages contains forward-looking statements that involve risks and uncertainties. Markets and instruments profiled on this page are for informational purposes only and should not in any way come across as a recommendation to buy or sell in these assets. You should do your own thorough research before making any investment decisions. FXStreet does not in any way guarantee that this information is free from mistakes, errors, or material misstatements. It also does not guarantee that this information is of a timely nature. Investing in Open Markets involves a great deal of risk, including the loss of all or a portion of your investment, as well as emotional distress. All risks, losses and costs associated with investing, including total loss of principal, are your responsibility. The views and opinions expressed in this article are those of the authors and do not necessarily reflect the official policy or position of FXStreet nor its advertisers. The author will not be held responsible for information that is found at the end of links posted on this page.
If not otherwise explicitly mentioned in the body of the article, at the time of writing, the author has no position in any stock mentioned in this article and no business relationship with any company mentioned. The author has not received compensation for writing this article, other than from FXStreet.
FXStreet and the author do not provide personalized recommendations. The author makes no representations as to the accuracy, completeness, or suitability of this information. FXStreet and the author will not be liable for any errors, omissions or any losses, injuries or damages arising from this information and its display or use. Errors and omissions excepted.
The author and FXStreet are not registered investment advisors and nothing in this article is intended to be investment advice.
Recommended content
Editors’ Picks

USD/JPY trades below two-week top set on Thursday; looks to BoJ for fresh impetus
USD/JPY trades with a positive bias below the 143.00 mark as traders await the BoJ policy update before placing fresh directional bets. In the meantime, data published this Friday showed that Japan's Core CPI rose to a 10-month high in August and reaffirmed bets that the BoJ will hike interest rates again in 2024.

AUD/USD strengthens above 0.6800 on RBA-Fed policy divergence, eyes on PBoC rate decision
The AUD/USD pair trades on a stronger note near 0.6810 during the early Asian session on Friday. The uptick of the pair is bolstered by the softer US Dollar amid the prospects of further rate cuts by the US Federal Reserve this year. Later on Friday, the Fed’s Patrick Harker is set to speak.

Gold price holds steady near record peak amid bets for more Fed rate cuts
Gold price hovers near the all-time peak touched earlier this week amid a bearish USD and rising bets for more upcoming rate cuts by the Fed. Moreover, concerns about an economic downturn in the US and China further underpin the safe-haven XAU/USD.

Bank of Japan set to keep rates on hold after July’s hike shocked markets
The Bank of Japan is expected to keep its short-term interest rate target between 0.15% and 0.25% on Friday, following the conclusion of its two-day monetary policy review. The decision is set to be announced during the early Asian session.

XRP eyes gains as Ripple gears up for stablecoin launch, Grayscale XRP Trust notes rising NAV
Ripple (XRP) gained 2.3% since the start of the week. The altcoin’s gains are likely powered by key market movers that include Ripple USD (RUSD) stablecoin, Grayscale XRP Trust performance and the demand for the altcoin among institutional investors.

Moneta Markets review 2024: All you need to know
VERIFIED In this review, the FXStreet team provides an independent and thorough analysis based on direct testing and real experiences with Moneta Markets – an excellent broker for novice to intermediate forex traders who want to broaden their knowledge base.