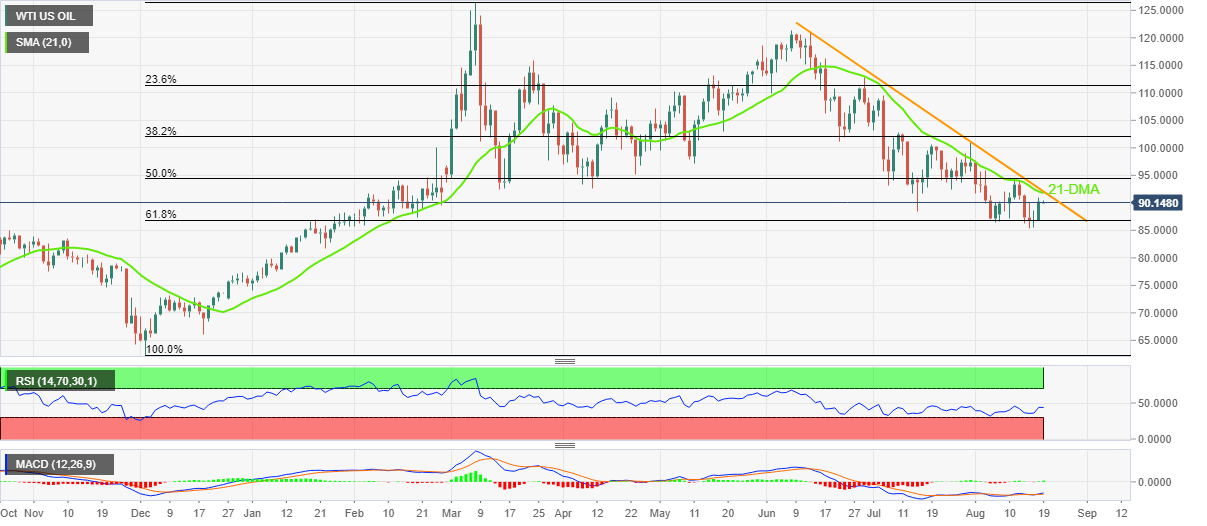
- WTI crude oil prices remain firmer after bouncing off the key Fibonacci retracement support.
- 21-DMA, two-month-old descending trend line challenge upside momentum.
- Sluggish MACD, RSI rebound adds to the trading filters.
The price of WTI crude oil remains firmer around the weekly top, picking up bids to $90.30 during Friday’s Asian session.
That said, the black gold portrayed the biggest daily gains in a month the previous day while bouncing off the 61.8% Fibonacci retracement level of December 2021 to March 2022 upside, around $86.85 by the press time.
It’s worth noting, however, that the quote remains below a convergence of the 21-DMA and a downward sloping resistance line from mid-June, around $92.00. Also portraying the lack of upside momentum is the recently steady RSI and sluggish MACD signals.
Hence, the crude oil buyers should wait for a daily closing beyond $92.00 before lauding the latest success. Following that, a run-up towards the latest July swing high near $101.00 can’t be ruled out.
On the contrary, the aforementioned key Fibonacci retracement level surrounding $86.85 precedes the recent multi-month low, marked on Tuesday around $85.40, to restrict the short-term WTI downside.
In a case where energy bears keep reins below $85.40, the late January 2022 high near $81.70 may act as an intermediate halt before directing the prices towards the $80.00 threshold.
WTI: Daily chart
Trend: Further upside expected
Information on these pages contains forward-looking statements that involve risks and uncertainties. Markets and instruments profiled on this page are for informational purposes only and should not in any way come across as a recommendation to buy or sell in these assets. You should do your own thorough research before making any investment decisions. FXStreet does not in any way guarantee that this information is free from mistakes, errors, or material misstatements. It also does not guarantee that this information is of a timely nature. Investing in Open Markets involves a great deal of risk, including the loss of all or a portion of your investment, as well as emotional distress. All risks, losses and costs associated with investing, including total loss of principal, are your responsibility. The views and opinions expressed in this article are those of the authors and do not necessarily reflect the official policy or position of FXStreet nor its advertisers. The author will not be held responsible for information that is found at the end of links posted on this page.
If not otherwise explicitly mentioned in the body of the article, at the time of writing, the author has no position in any stock mentioned in this article and no business relationship with any company mentioned. The author has not received compensation for writing this article, other than from FXStreet.
FXStreet and the author do not provide personalized recommendations. The author makes no representations as to the accuracy, completeness, or suitability of this information. FXStreet and the author will not be liable for any errors, omissions or any losses, injuries or damages arising from this information and its display or use. Errors and omissions excepted.
The author and FXStreet are not registered investment advisors and nothing in this article is intended to be investment advice.
Recommended content
Editors’ Picks

EUR/USD consolidates weekly gains above 1.1150
EUR/USD moves up and down in a narrow channel slightly above 1.1150 on Friday. In the absence of high-tier macroeconomic data releases, comments from central bank officials and the risk mood could drive the pair's action heading into the weekend.

GBP/USD stabilizes near 1.3300, looks to post strong weekly gains
GBP/USD trades modestly higher on the day near 1.3300, supported by the upbeat UK Retail Sales data for August. The pair remains on track to end the week, which featured Fed and BoE policy decisions, with strong gains.

Gold extends rally to new record-high above $2,610
Gold (XAU/USD) preserves its bullish momentum and trades at a new all-time high above $2,610 on Friday. Heightened expectations that global central banks will follow the Fed in easing policy and slashing rates lift XAU/USD.

Week ahead – SNB to cut again, RBA to stand pat, PCE inflation also on tap
SNB is expected to ease for third time; might cut by 50bps. RBA to hold rates but could turn less hawkish as CPI falls. After inaugural Fed cut, attention turns to PCE inflation.

Bank of Japan set to keep rates on hold after July’s hike shocked markets
The Bank of Japan is expected to keep its short-term interest rate target between 0.15% and 0.25% on Friday, following the conclusion of its two-day monetary policy review. The decision is set to be announced during the early Asian session.

Moneta Markets review 2024: All you need to know
VERIFIED In this review, the FXStreet team provides an independent and thorough analysis based on direct testing and real experiences with Moneta Markets – an excellent broker for novice to intermediate forex traders who want to broaden their knowledge base.