WTI Price Analysis: Bears poke $76.00 with eyes on further downside
- WTI remains pressured around the monthly low, extends Friday’s losses.
- Six-week-old descending trend line can test the bears on the way to sub-$70.00 area.
- Double-top confirmation adds strength to the bearish bias.
- Buyers need to cross $81.30 to retake control.

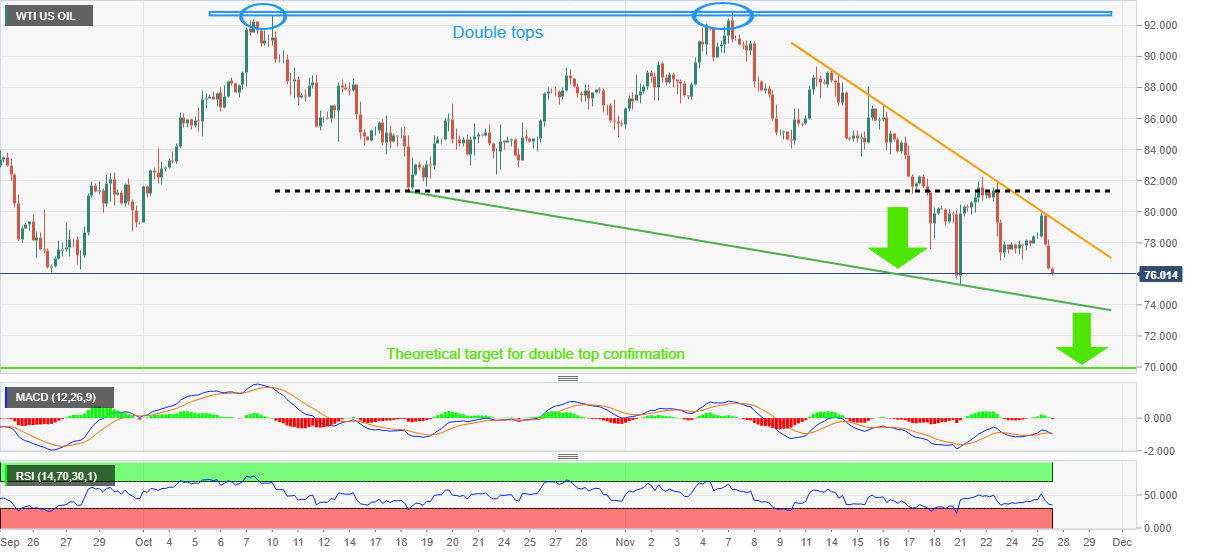
WTI crude oil price stays depressed as it flirts with $76.00 during early Monday. In doing so, the black gold drops for the second consecutive day while highlighting mid-November’s confirmation of the double-top bearish chart pattern.
Even so, the nearly oversold Relative Strength Index (RSI), placed at 14, highlights a downward-sloping support line from October 18, close to $74.30, as immediate key support.
Following that, a south-run towards the theoretical target for the “Double Top” confirmation, near $69.80, can’t be ruled out. It’s worth noting that the $70.00 round figure may act as a buffer during the anticipated fall.
On the flip side, recovery moves may initially need to cross a two-week-old resistance line near $79.60 to convince the short-term buyers.
However, a horizontal line around $81.30, known as the confirmation level for the “double top” bearish chart pattern, appears crucial for WTI crude oil buyers as it holds the key to their conviction.
In a case where the crude oil buyers manage to keep the reins past $81.30, the odds of witnessing a run-up towards $93.00, comprising the monthly high and October’s peak, will be in focus.
WTI: Four-hour chart
Trend: Bearish
Author

Anil Panchal
FXStreet
Anil Panchal has nearly 15 years of experience in tracking financial markets. With a keen interest in macroeconomics, Anil aptly tracks global news/updates and stays well-informed about the global financial moves and their implications.


