- WTI refrains from entertaining pullback from a five-month high.
- Sustained trading beyond 50-day SMA, MACD/RSI conditions signal further room to the north.
- June month’s top offers immediate support, February’s low can please buyers.
WTI picks up bids near $42.50 during the early Thursday morning in Asia. The energy benchmark surged to the highest since early March the previous day but failed to cross 200-day SMA and 61.8% Fibonacci retracement level of January-April downside.
Even so, oil buyers are cheering the successful trading beyond 50-day SMA while MACD is flirting with the bulls and RSI is yet to visit the overbought region. All these catalysts favor the black gold’s further upside. Though, a clear break above $43.75, comprising the aforementioned Fibonacci retracement becomes the key.
It should be noted that $43.00 and $43.27 comprising 200-day SMA can offer immediate resistance to the quote.
In a case where the energy benchmark manages to conquer $43.75, February month’s low near $44.00 holds the key to the further upside towards March 03 top near $48.75.
Alternatively, June month’s top of $41.64 can entertain sellers during the pullback ahead of $40.00 and 50-day SMA level near $39.70. If at all the bears dominate past-$39.70, 50% Fibonacci retracement level of $37.10 will be in focus.
WTI daily chart
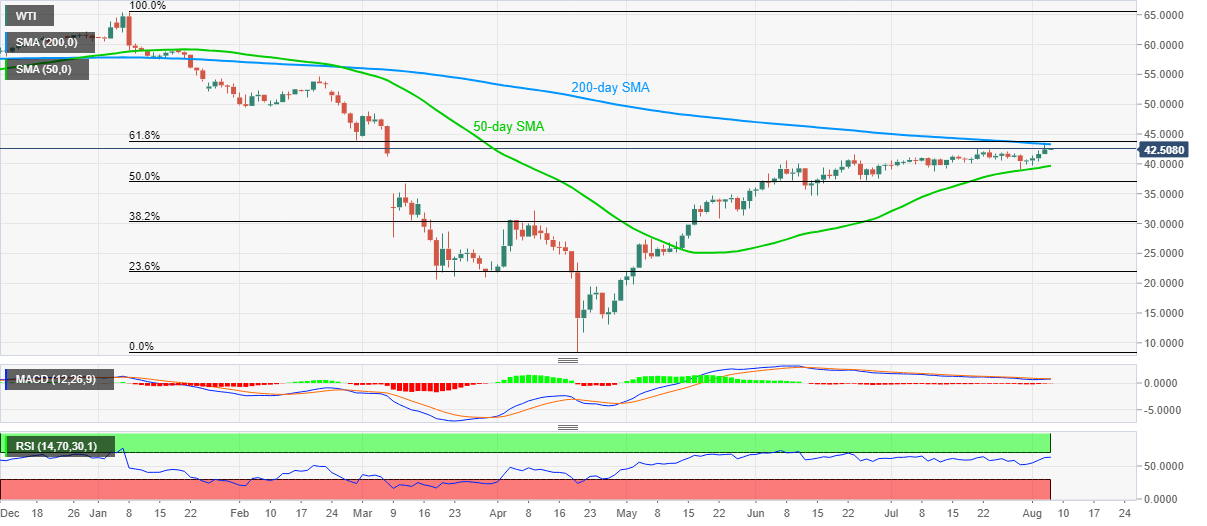
Trend: Bullish
Information on these pages contains forward-looking statements that involve risks and uncertainties. Markets and instruments profiled on this page are for informational purposes only and should not in any way come across as a recommendation to buy or sell in these assets. You should do your own thorough research before making any investment decisions. FXStreet does not in any way guarantee that this information is free from mistakes, errors, or material misstatements. It also does not guarantee that this information is of a timely nature. Investing in Open Markets involves a great deal of risk, including the loss of all or a portion of your investment, as well as emotional distress. All risks, losses and costs associated with investing, including total loss of principal, are your responsibility. The views and opinions expressed in this article are those of the authors and do not necessarily reflect the official policy or position of FXStreet nor its advertisers. The author will not be held responsible for information that is found at the end of links posted on this page.
If not otherwise explicitly mentioned in the body of the article, at the time of writing, the author has no position in any stock mentioned in this article and no business relationship with any company mentioned. The author has not received compensation for writing this article, other than from FXStreet.
FXStreet and the author do not provide personalized recommendations. The author makes no representations as to the accuracy, completeness, or suitability of this information. FXStreet and the author will not be liable for any errors, omissions or any losses, injuries or damages arising from this information and its display or use. Errors and omissions excepted.
The author and FXStreet are not registered investment advisors and nothing in this article is intended to be investment advice.
Recommended content
Editors’ Picks

EUR/USD consolidates weekly gains above 1.1150
EUR/USD moves up and down in a narrow channel slightly above 1.1150 on Friday. In the absence of high-tier macroeconomic data releases, comments from central bank officials and the risk mood could drive the pair's action heading into the weekend.

GBP/USD stabilizes near 1.3300, looks to post strong weekly gains
GBP/USD trades modestly higher on the day near 1.3300, supported by the upbeat UK Retail Sales data for August. The pair remains on track to end the week, which featured Fed and BoE policy decisions, with strong gains.

Gold extends rally to new record-high above $2,610
Gold (XAU/USD) preserves its bullish momentum and trades at a new all-time high above $2,610 on Friday. Heightened expectations that global central banks will follow the Fed in easing policy and slashing rates lift XAU/USD.

Week ahead – SNB to cut again, RBA to stand pat, PCE inflation also on tap
SNB is expected to ease for third time; might cut by 50bps. RBA to hold rates but could turn less hawkish as CPI falls. After inaugural Fed cut, attention turns to PCE inflation.

Bank of Japan set to keep rates on hold after July’s hike shocked markets
The Bank of Japan is expected to keep its short-term interest rate target between 0.15% and 0.25% on Friday, following the conclusion of its two-day monetary policy review. The decision is set to be announced during the early Asian session.

Moneta Markets review 2024: All you need to know
VERIFIED In this review, the FXStreet team provides an independent and thorough analysis based on direct testing and real experiences with Moneta Markets – an excellent broker for novice to intermediate forex traders who want to broaden their knowledge base.