|

USD/MXN Price Analysis: Mexican Peso grinds between 21-DMA and 10-DMA around 16.85

  • USD/MXN licks its wounds within one-week-old trading range.
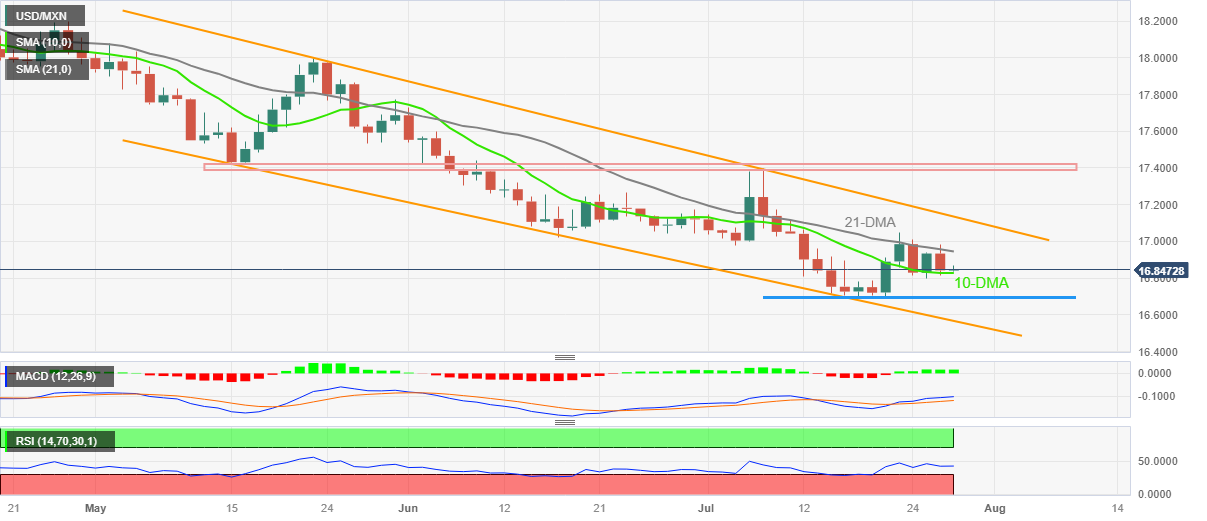
  • MACD, RSI signals prod short-term Mexican Peso buyers but falling trend channel from mid-May keeps the bulls hopeful.
  • Fortnight-old horizontal support acts as additional trading filter, bulls need validation from 17.42 to retake control.

USD/MXN stabilizes near 16.85 amid an inactive Thursday morning in Asia, after posting heavy losses the previous day. With this, the Mexican Peso (MXN) pair stays within its one-week-long trading range between the 21-DMA and 10-DMA.

Given the Mexican Peso pair’s latest rebound from the 10-DMA gaining support from the bullish MACD signals and the steady RSI (14) line, the USD/MXN price is likely to improve.

However, a clear upside break of the 21-DMA hurdle of around 16.95 becomes necessary to convince the pair buyers.

Even so, a 10-week-old bearish trend channel, currently between 17.14 and 16.35, will restrict the USD/MXN upside.

It’s worth observing that a horizontal area comprising multiple levels marked since mid-May, around 17.38-42, acts as the last defense of the USD/MXN bears.

On the contrary, a downside break of the 10-DMA support of around 16.82 isn’t an open welcome for the USD/MXN bears as a fortnight-old horizontal support near 16.70 acts as a tough nut to crack for the sellers.

Following that, the bottom line of the previously mentioned bearish channel, near 16.35, will lure the pair bears ahead of highlighting the 16.00 round figure.

USD/MXN: Daily chart

Trend: Limited recovery expected

Additional important levels

Overview
Today last price16.8492
Today Daily Change0.0064
Today Daily Change %0.04%
Today daily open16.8428
 
Trends
Daily SMA2016.9508
Daily SMA5017.2302
Daily SMA10017.6831
Daily SMA20018.4188
 
Levels
Previous Daily High16.9837
Previous Daily Low16.8166
Previous Weekly High17.0512
Previous Weekly Low16.6924
Previous Monthly High17.7286
Previous Monthly Low17.0243
Daily Fibonacci 38.2%16.8804
Daily Fibonacci 61.8%16.9199
Daily Pivot Point S116.7783
Daily Pivot Point S216.7139
Daily Pivot Point S316.6112
Daily Pivot Point R116.9455
Daily Pivot Point R217.0482
Daily Pivot Point R317.1126

Author

Anil Panchal

Anil Panchal

FXStreet

Anil Panchal has nearly 15 years of experience in tracking financial markets. With a keen interest in macroeconomics, Anil aptly tracks global news/updates and stays well-informed about the global financial moves and their implications.

More from Anil Panchal
Share:

Markets move fast. We move first.

Orange Juice Newsletter brings you expert driven insights - not headlines. Every day on your inbox.

By subscribing you agree to our Terms and conditions.

Editor's Picks

EUR/USD moves sideways below 1.1800 on Christmas Eve

EUR/USD struggles to find direction and trades in a narrow channel below 1.1800 after posting gains for two consecutive days. Bond and stock markets in the US will open at the usual time and close early on Christmas Eve, allowing the trading action to remain subdued. 

GBP/USD keeps range around 1.3500 amid quiet markets

GBP/USD keeps its range trade intact at around 1.3500 on Wednesday. The Pound Sterling holds the upper hand over the US Dollar amid pre-Christmas light trading as traders move to the sidelines heading into the holiday season. 

Gold retreats from record highs, trades below $4,500

Gold retreats after setting a new record-high above $4,520 earlier in the day and trades in a tight range below $4,500 as trading volumes thin out ahead of the Christmas break. The US Dollar selling bias remains unabated on the back of dovish Fed expectations, which continues to act as a tailwind for the bullion amid persistent geopolitical risks.

Bitcoin slips below $87,000 as ETF outflows intensify, whale participation declines

Bitcoin price continues to trade around $86,770 on Wednesday, after failing to break above the $90,000 resistance. US-listed spot ETFs record an outflow of $188.64 million on Tuesday, marking the fourth consecutive day of withdrawals.

Economic outlook 2026-2027 in advanced countries: Solidity test

After a year marked by global economic resilience and ending on a note of optimism, 2026 looks promising and could be a year of solid economic performance. In our baseline scenario, we expect most of the supportive factors at work in 2025 to continue to play a role in 2026.

Avalanche struggles near $12 as Grayscale files updated form for ETF

Avalanche trades close to $12 by press time on Wednesday, extending the nearly 2% drop from the previous day. Grayscale filed an updated form to convert its Avalanche-focused Trust into an ETF with the US Securities and Exchange Commission.