USD/MXN Price Analysis: Ignores Wednesday’s Dragonfly Doji to retreat to 18.60


  • USD/MXN fades bounce off one-week low as 50-DMA pushes back bullish bias.
  • Bullish candlestick formation, clear bounce off 21-DMA challenges sellers.
  • MACD, RSI conditions suggest further grinding towards the south.
  • Buyers need successful break of 61.8% Fibonacci retracement for conviction.

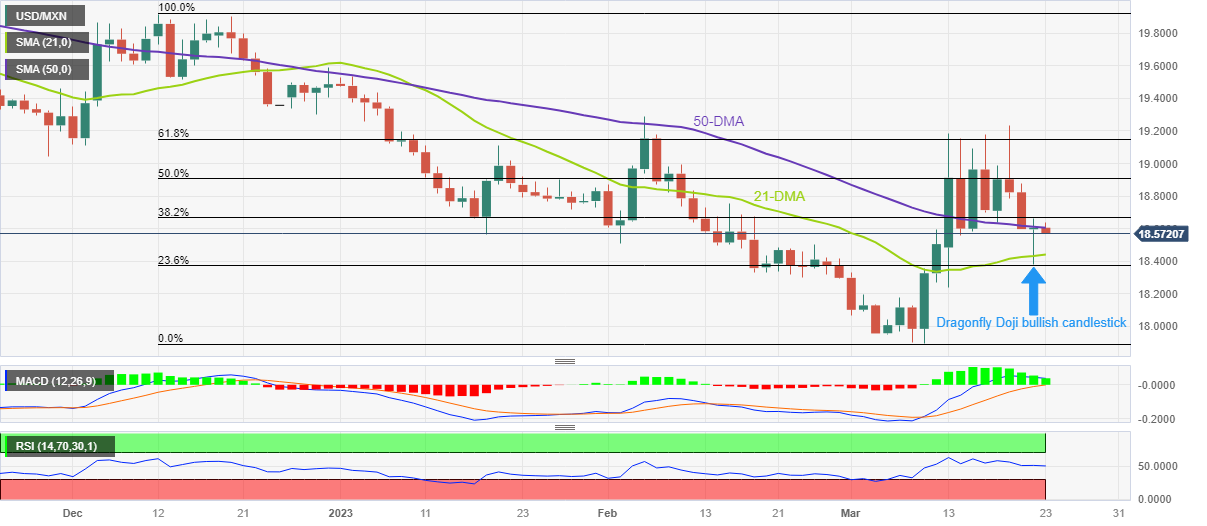
USD/MXN takes offers to refresh intraday low near 18.57 during early Thursday, reversing the previous day’s rebound from the 21-DMA.

In doing so, the Mexican Peso (MXN) pair fails to justify Wednesday’s Dragonfly Doji bullish candlestick while dropping back towards the lowest levels since March 13 marked on the previous day.

It’s worth noting that the USD/MXN pair’s failure to cross the 50-DMA during late Wednesday’s corrective bounce keeps the sellers hopeful. Adding strength to the downside bias is the downward-sloping MACD line and the RSI (14) retreat.

As a result, the USD/MXN is likely to drop back to the 21-DMA support of 18.44 before highlighting the 18.30 support.

In a case where the Mexican Peso pair drops below 18.30, the 18.00 threshold could act as the last defense of the bulls before highlighting the odds of witnessing a fresh low since 2017, currently 17.90.

Alternatively, recovery moves need validation from the 50-DMA hurdle of 18.60 to renew upside momentum targeting the 50% and 61.8% Fibonacci retracements of the USD/MXN pair’s fall from December 2022 to March, respectively near 18.90 and 19.15.

Should the USD/MXN pair rises past 19.15, February’s high of 19.30 can challenge the buyers for the one last time.

USD/MXN: Daily chart

Trend: Further downside expected

Additional important levels

Overview
Today last price 18.5749
Today Daily Change -0.0307
Today Daily Change % -0.17%
Today daily open 18.6056
 
Trends
Daily SMA20 18.4346
Daily SMA50 18.6111
Daily SMA100 19.0383
Daily SMA200 19.5982
 
Levels
Previous Daily High 18.6626
Previous Daily Low 18.3797
Previous Weekly High 19.1812
Previous Weekly Low 18.2397
Previous Monthly High 19.2901
Previous Monthly Low 18.2954
Daily Fibonacci 38.2% 18.5545
Daily Fibonacci 61.8% 18.4877
Daily Pivot Point S1 18.436
Daily Pivot Point S2 18.2664
Daily Pivot Point S3 18.1531
Daily Pivot Point R1 18.7189
Daily Pivot Point R2 18.8322
Daily Pivot Point R3 19.0019


Share: Feed news

Information on these pages contains forward-looking statements that involve risks and uncertainties. Markets and instruments profiled on this page are for informational purposes only and should not in any way come across as a recommendation to buy or sell in these assets. You should do your own thorough research before making any investment decisions. FXStreet does not in any way guarantee that this information is free from mistakes, errors, or material misstatements. It also does not guarantee that this information is of a timely nature. Investing in Open Markets involves a great deal of risk, including the loss of all or a portion of your investment, as well as emotional distress. All risks, losses and costs associated with investing, including total loss of principal, are your responsibility. The views and opinions expressed in this article are those of the authors and do not necessarily reflect the official policy or position of FXStreet nor its advertisers. The author will not be held responsible for information that is found at the end of links posted on this page.

If not otherwise explicitly mentioned in the body of the article, at the time of writing, the author has no position in any stock mentioned in this article and no business relationship with any company mentioned. The author has not received compensation for writing this article, other than from FXStreet.

FXStreet and the author do not provide personalized recommendations. The author makes no representations as to the accuracy, completeness, or suitability of this information. FXStreet and the author will not be liable for any errors, omissions or any losses, injuries or damages arising from this information and its display or use. Errors and omissions excepted.

The author and FXStreet are not registered investment advisors and nothing in this article is intended to be investment advice.

Recommended content


Recommended content

Editors’ Picks

EUR/USD retreats to 1.0750, eyes on Fedspeak

EUR/USD retreats to 1.0750, eyes on Fedspeak

EUR/USD stays under modest bearish pressure and trades at around 1.0750 on Wednesday. Hawkish comments from Fed officials help the US Dollar stay resilient and don't allow the pair to stage a rebound.

EUR/USD News

GBP/USD struggles to hold above 1.2500 ahead of Thursday's BoE event

GBP/USD struggles to hold above 1.2500 ahead of Thursday's BoE event

GBP/USD stays on the back foot and trades in negative territory below 1.2500 after losing nearly 0.5% on Tuesday. The renewed US Dollar strength on hawkish Fed comments weighs on the pair as market focus shifts to the BoE's policy announcements on Thursday.

GBP/USD News

Gold fluctuates in narrow range above $2,300

Gold fluctuates in narrow range above $2,300

Gold struggles to make a decisive move in either direction and moves sideways in a narrow channel above $2,300. The benchmark 10-year US Treasury bond yield clings to modest gains near 4.5% and limits XAU/USD's upside.

Gold News

SEC vs. Ripple lawsuit sees redacted filing go public, XRP dips to $0.51

SEC vs. Ripple lawsuit sees redacted filing go public, XRP dips to $0.51

Ripple (XRP) dipped to $0.51 low on Wednesday, erasing its gains from earlier this week. The Securities and Exchange Commission (SEC) filing is now public, in its redacted version. 

Read more

Softer growth, cooler inflation and rate cuts remain on the horizon

Softer growth, cooler inflation and rate cuts remain on the horizon

Economic growth in the US appears to be in solid shape. Although real GDP growth came in well below consensus expectations, the headline miss was mostly the result of larger-than-anticipated drags from trade and inventories.

Read more

Forex MAJORS

Cryptocurrencies

Signatures