• USD/JPY recovers after diving to a YTD low; a daily close above 140.25 paves the way for further upside.
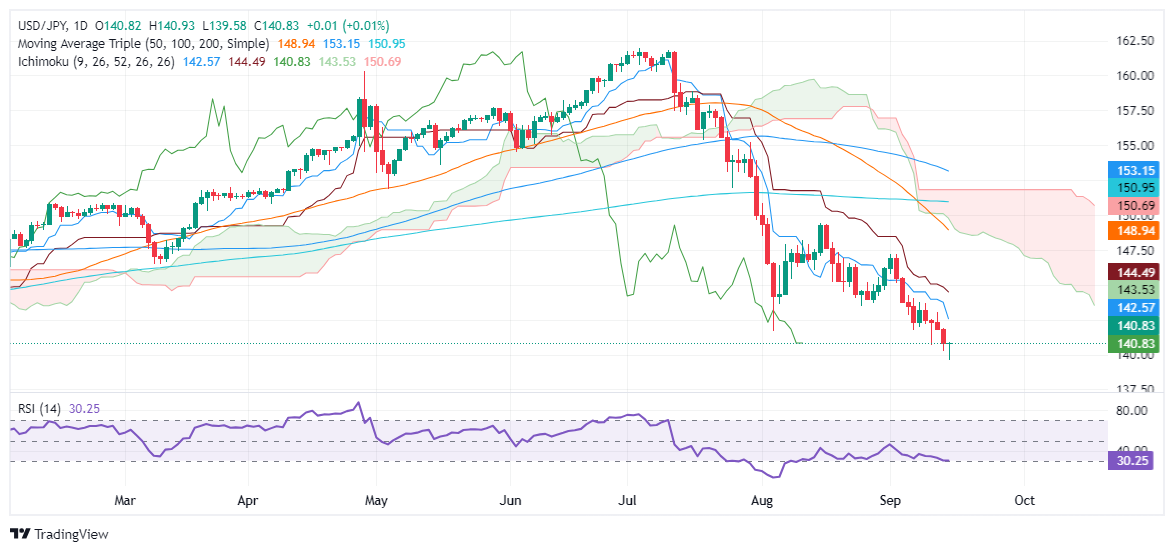
  • Key resistance levels include 142.57 (Tenkan-Sen), 143.52 (Senkou Span A), and 144.48 (Kijun-Sen).
  • Momentum remains bearish, but bullish patterns like a ‘dragonfly doji’ or ‘hammer’ could signal a leg higher if confirmed.

The USD/JPY recovers some ground late in the North American session after touching a new year-to-date (YTD) low of 139.58 earlier in the day. At the time of writing, the major pair traded at 140.85 and registered minimal gains of 0.03%.

USD/JPY Price Forecast: Technical outlook

The downtrend would likely continue after clearing December’s 28 low of 140.25, but USD/JPY buyers bought the dip, clearing the latter as the pair aims towards 141.00.

A daily close above 140.25 would open the way to testing key resistance levels amid a busy week of monetary policy decisions from the Federal Reserve and the Bank of Japan.

Momentum hints that sellers remain in control, as shown by the Relative Strength Index (RSI). But if Monday’s price action completes a ‘dragon-fly doji’ or a ‘hammer,’ look for a leg up.

On further strength, USD/JPY's first resistance would be the Tenkan-Sen at 142.57, followed by the Senkou Span A at 143.52. If those levels are cleared, buyers can aim for the Kijun-Sen at 144.48.

Conversely, if sellers drag prices below 140.25, that can pave the way for further downside.

USD/JPY Price Action – Daily Chart

Japanese Yen PRICE Today

The table below shows the percentage change of Japanese Yen (JPY) against listed major currencies today. Japanese Yen was the strongest against the US Dollar.

  USD EUR GBP JPY CAD AUD NZD CHF
USD   -0.44% -0.65% 0.06% -0.05% -0.64% -0.49% -0.25%
EUR 0.44%   -0.27% 0.44% 0.36% -0.26% -0.11% 0.15%
GBP 0.65% 0.27%   0.65% 0.62% 0.00% 0.17% 0.42%
JPY -0.06% -0.44% -0.65%   -0.10% -0.63% -0.51% -0.36%
CAD 0.05% -0.36% -0.62% 0.10%   -0.67% -0.44% -0.31%
AUD 0.64% 0.26% -0.00% 0.63% 0.67%   0.16% 0.40%
NZD 0.49% 0.11% -0.17% 0.51% 0.44% -0.16%   0.25%
CHF 0.25% -0.15% -0.42% 0.36% 0.31% -0.40% -0.25%  

The heat map shows percentage changes of major currencies against each other. The base currency is picked from the left column, while the quote currency is picked from the top row. For example, if you pick the Japanese Yen from the left column and move along the horizontal line to the US Dollar, the percentage change displayed in the box will represent JPY (base)/USD (quote).


Share: Feed news

Information on these pages contains forward-looking statements that involve risks and uncertainties. Markets and instruments profiled on this page are for informational purposes only and should not in any way come across as a recommendation to buy or sell in these assets. You should do your own thorough research before making any investment decisions. FXStreet does not in any way guarantee that this information is free from mistakes, errors, or material misstatements. It also does not guarantee that this information is of a timely nature. Investing in Open Markets involves a great deal of risk, including the loss of all or a portion of your investment, as well as emotional distress. All risks, losses and costs associated with investing, including total loss of principal, are your responsibility. The views and opinions expressed in this article are those of the authors and do not necessarily reflect the official policy or position of FXStreet nor its advertisers. The author will not be held responsible for information that is found at the end of links posted on this page.

If not otherwise explicitly mentioned in the body of the article, at the time of writing, the author has no position in any stock mentioned in this article and no business relationship with any company mentioned. The author has not received compensation for writing this article, other than from FXStreet.

FXStreet and the author do not provide personalized recommendations. The author makes no representations as to the accuracy, completeness, or suitability of this information. FXStreet and the author will not be liable for any errors, omissions or any losses, injuries or damages arising from this information and its display or use. Errors and omissions excepted.

The author and FXStreet are not registered investment advisors and nothing in this article is intended to be investment advice.

XM
Account
7.2
Tools
9.2
Service
9.4
Trading
9.0
Trust
7.0
Experience
8.4
Read review
Moneta Markets
Account
7.4
Tools
6.6
Service
8.0
Trading
6.6
Trust
5.2
Experience
9.2
Read review
Trading Pro
Account
7.2
Tools
5.2
Service
6.6
Trading
8.0
Trust
5.0
Experience
7.0
Read review
Pepperstone
Account
8.2
Tools
8.2
Service
7.4
Trading
9.0
Trust
8.8
Experience
9.0
Read review
XM
Read review
Moneta Markets
Read review
Trading Pro
Read review
Pepperstone
Read review
Trading Pro
Read review
Pepperstone
Read review
XM
Read review
Moneta Markets
Read review
Trading Pro
Account
7.2
Tools
5.2
Service
6.6
Trading
8.0
Trust
5.0
Experience
7.0
Read review
Pepperstone
Account
8.2
Tools
8.2
Service
7.4
Trading
9.0
Trust
8.8
Experience
9.0
Read review
XM
Account
7.2
Tools
9.2
Service
9.4
Trading
9.0
Trust
7.0
Experience
8.4
Read review
Moneta Markets
Account
7.4
Tools
6.6
Service
8.0
Trading
6.6
Trust
5.2
Experience
9.2
Read review

Recommended content


Recommended content

Editors’ Picks

Gold hovers around all-time highs near $3,250

Gold hovers around all-time highs near $3,250


Gold is holding steady near the $3,250 mark, fuelled by robust safe-haven demand, trade war concerns, and a softer-than-expected US inflation gauge. The US Dollar keeps trading with heavy losses around three-year lows.

Gold News
EUR/USD retreats towards 1.1300 as Wall Street shrugs off trade war headlines

EUR/USD retreats towards 1.1300 as Wall Street shrugs off trade war headlines

The EUR/USD pair retreated further from its recent multi-month peak at 1.1473 and trades around the 1.1300 mark. Wall Street manages to advance ahead of the weekly close, despite escalating tensions between Washington and Beijing and mounting fears of a US recession. Profit-taking ahead of the close also weighs on the pair. 

EUR/USD News
GBP/USD trims gains, recedes to the 1.3050 zone

GBP/USD trims gains, recedes to the 1.3050 zone

GBP/USD now gives away part of the earlier advance to fresh highs near 1.3150. Meanwhile, the US Dollar remains offered amid escalating China-US trade tensions, recession fears in the US, and softer-than-expected US Producer Price data.

GBP/USD News
Bitcoin, Ethereum, Dogecoin and Cardano stabilze –  Why crypto is in limbo

Bitcoin, Ethereum, Dogecoin and Cardano stabilze –  Why crypto is in limbo

Bitcoin, Ethereum, Dogecoin and Cardano stabilize on Friday as crypto market capitalization steadies around $2.69 trillion. Crypto traders are recovering from the swing in token prices and the Monday bloodbath. 

Read more
Is a recession looming?

Is a recession looming?

Wall Street skyrockets after Trump announces tariff delay. But gains remain limited as Trade War with China continues. Recession odds have eased, but investors remain fearful. The worst may not be over, deeper market wounds still possible.

Read more
The Best brokers to trade EUR/USD

The Best brokers to trade EUR/USD

SPONSORED Discover the top brokers for trading EUR/USD in 2025. Our list features brokers with competitive spreads, fast execution, and powerful platforms. Whether you're a beginner or an expert, find the right partner to navigate the dynamic Forex market.

Read More

Forex MAJORS

Cryptocurrencies

Signatures

Best Brokers of 2025