|

USD/JPY Price Forecast: Decisively breaches key resistance yet bearish signs persist

  • USD/JPY decisively breaks above a critical level in a bullish sign.  
  • It may also have completed a three-wave correction of the medium-term downtrend with more bearish implications. 

USD/JPY decisively pieces and closes above both its long-term trendline and key upside obstacle in the form of the 147.24 October 3 high. This lends credence to the bullish view and suggests a possible continuation of the short-term uptrend to a tentative target at the next key resistance level of 149.40, the August 15 high.  

USD/JPY Daily Chart 

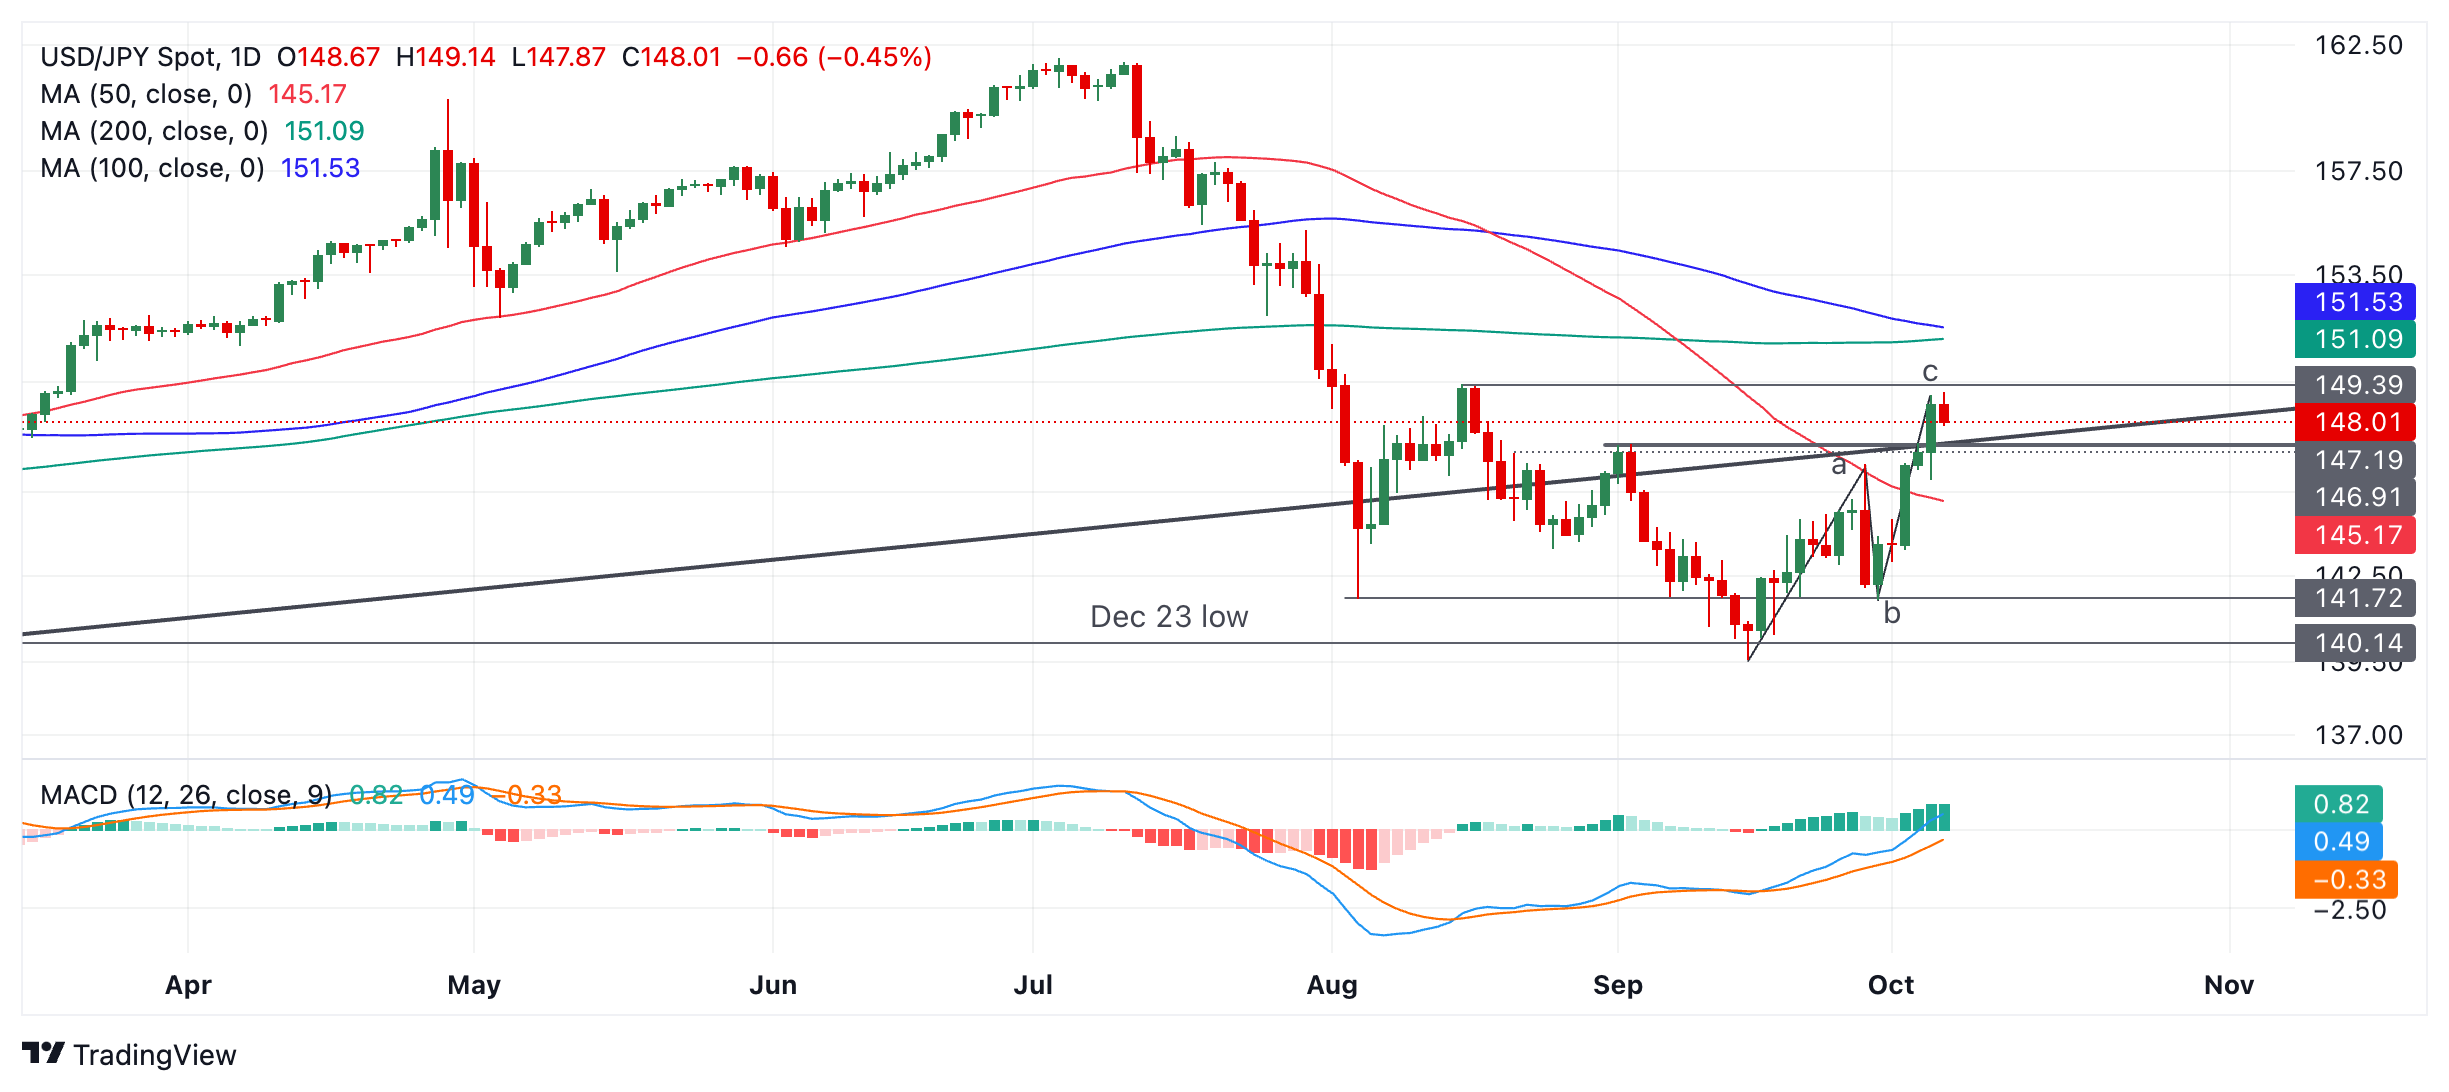
Momentum is broadly bullish since the August bottom and the Moving Average Convergence Divergence (MACD) indicator has consistently converged with price during September, and is now in positive territory. 

A close above 149.40 would provide more confirmation of an extension of the short-term uptrend higher, with the next target potentially at 151.09 and the 200-day Simple Moving Average (SMA).

Yet bullish enthusiasm should be tempered by the possibility that USD/JPY may have formed a three-wave “abc” corrective pattern of the medium-term downtrend during July. If so, the pair may start to decline again as the longer-term bearish cycle starts to take hold. However, it is still too early to say with any confidence and price action itself is not evidencing any weakness yet.
 

A close below the 50-day SMA at 145.24 would probably indicate a resumption of the medium-term downtrend from the summer. Such a move would be expected to reach the wave B lows at around 141.72. 

Author

Joaquin Monfort

Joaquin Monfort is a financial writer and analyst with over 10 years experience writing about financial markets and alt data. He holds a degree in Anthropology from London University and a Diploma in Technical analysis.

More from Joaquin Monfort
Share:

Editor's Picks

EUR/USD deflates to fresh lows, targets 1.1600

The selling pressure on EUR/USD now gathers extra pace, prompting the pair to hit fresh multi-week lows in the 1.1625-1.1620 band on Friday. The continuation of the downward bias comes in response to further gains in the US Dollar as market participants continue to assess the mixed release of US Nonfarm Payrolls in December.

GBP/USD breaks below 1.3400, challenges the 200-day SMA

GBP/USD remains under heavy fire and retreats for the fourth consecutive day on Friday. Indeed, Cable suffers the strong performance of the Greenback, intensified post-mixed NFP, and trades at shouting distance from its critical 200-day SMA near 1.3380.

Gold flirts with yearly tops around $4,500

Gold keeps its positive bias on Friday, adding to Thursday’s advance and challenging yearly highs in the $4,500 region per troy ounce. The risk-off sentiment favours the yellow metal despite the firmer tone in the Greenback and rising US Treasury yields.

Crypto Today: Bitcoin, Ethereum, XRP risk further decline as market fear persists amid slowing demand

Bitcoin holds $90,000 but stays below the 50-day EMA as institutional demand wanes. Ethereum steadies above $3,000 but remains structurally weak due to ETF outflows. XRP ETFs resume inflows, but the price struggles to gain ground above key support.

Week ahead – US CPI might challenge the geopolitics-boosted Dollar

Geopolitics may try to steal the limelight from US data. A possible US Supreme Court ruling on tariffs could dictate market movements. A crammed data calendar next week, US CPI comes on Tuesday; Fedspeak to intensify.

XRP trades under pressure amid weak retail demand

XRP presses down on the 50-day EMA support as risk-averse sentiment spreads despite a positive start to 2026. XRP faces declining retail demand, as reflected in futures Open Interest, which has fallen to $4.15 billion.