|

USD/JPY Price Forecast: Breaks below rising channel, weakening the uptrend

  • USD/JPY has broken out of a rising channel in a sign of weakness for the uptrend. 
  • RSI is diverging bearishly with price – a further negative sign. 

USD/JPY has been rallying higher since it reversed at the December 2023 low on September 16. 

It has established a sequence of higher highs and higher lows and could be said to be in a short-term uptrend.

USD/JPY 4-hour Chart 

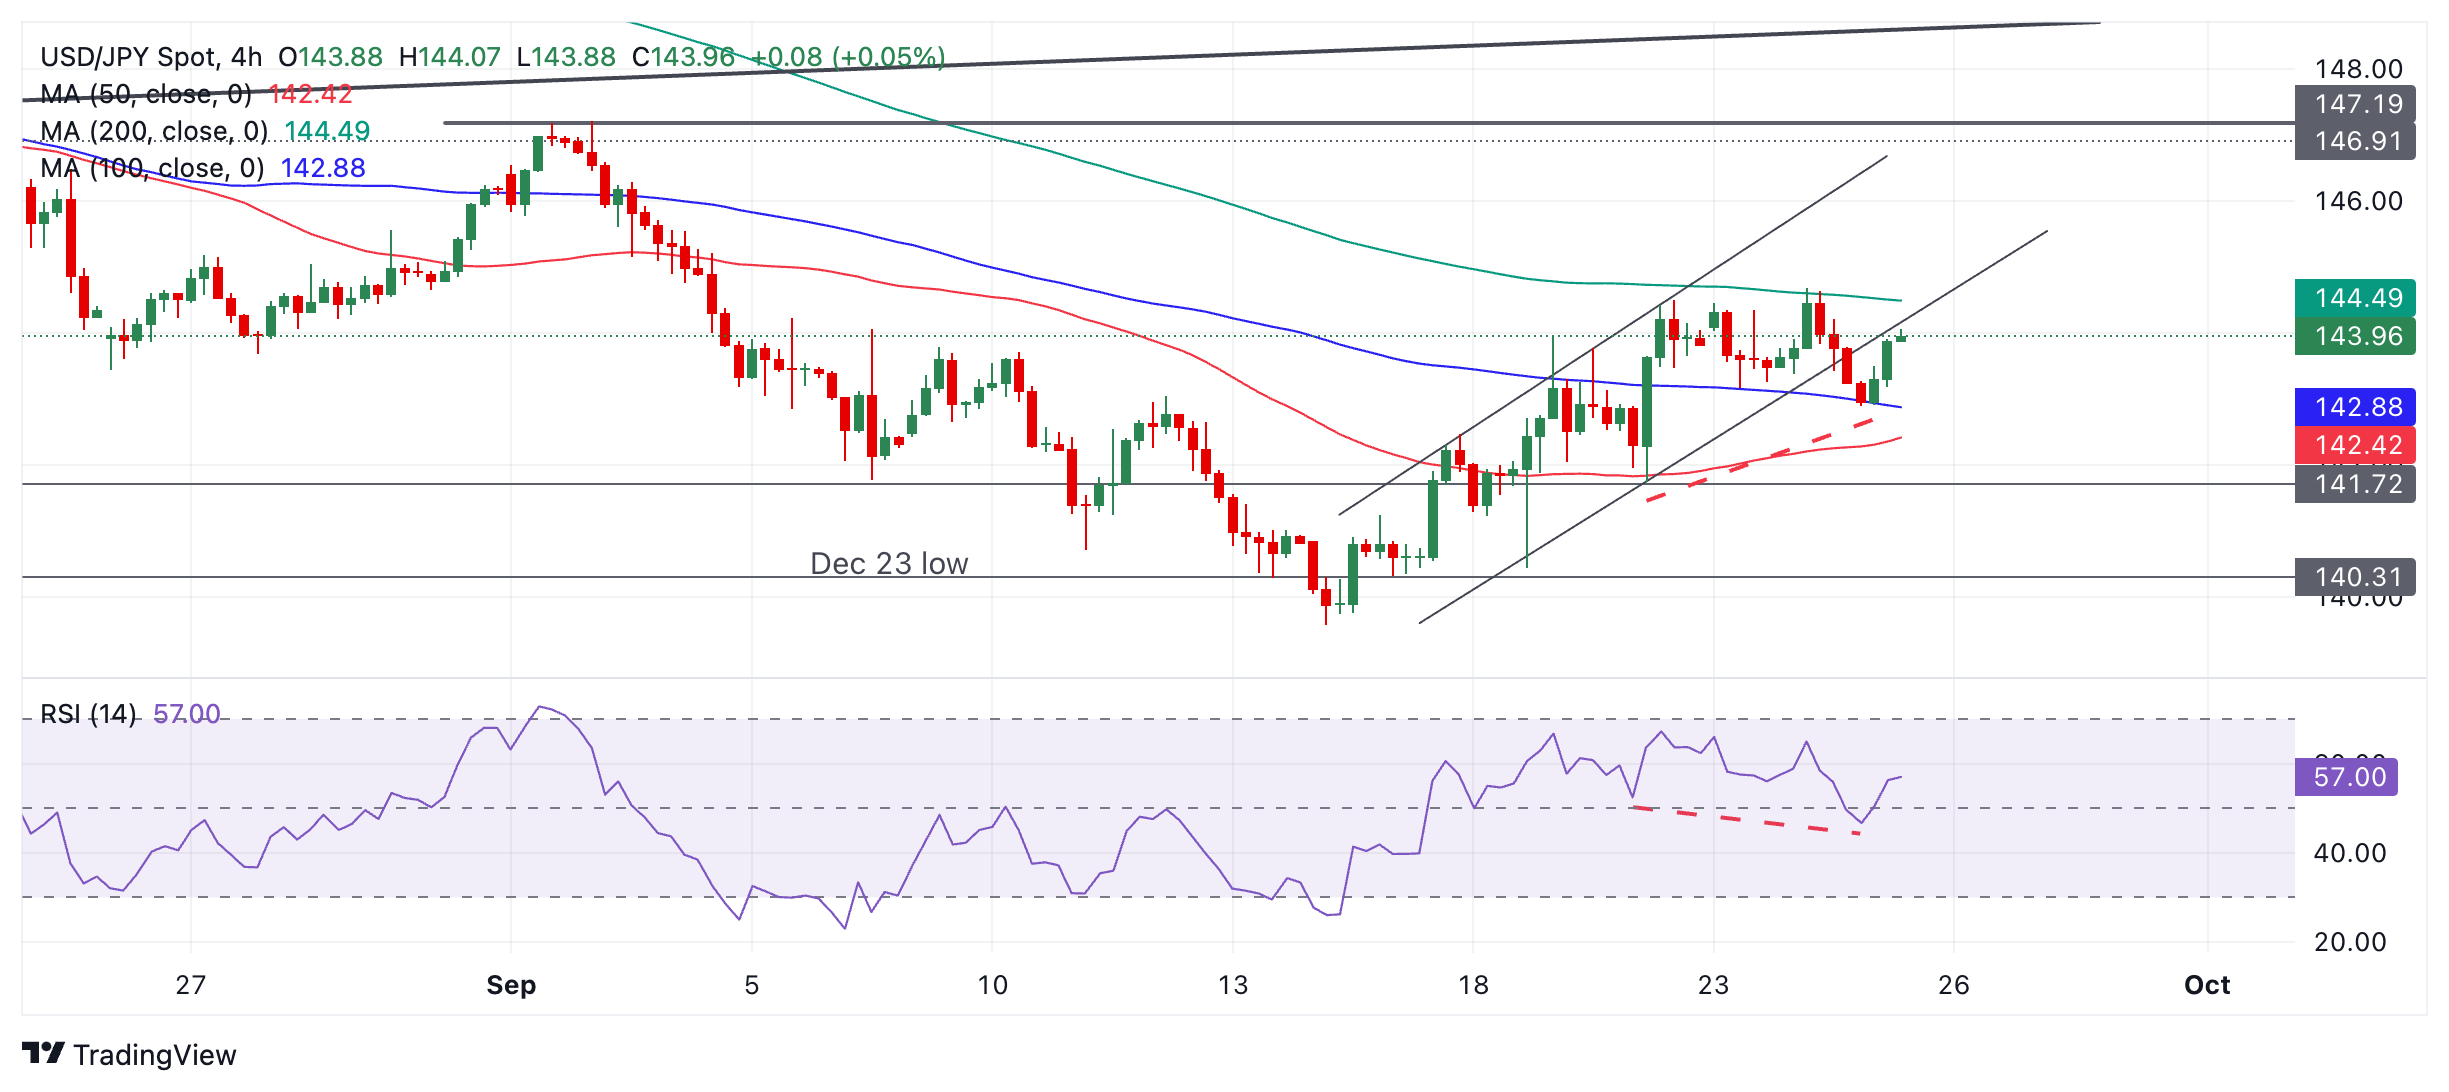
Given it is a principle of technical analysis that “the trend is your friend” the odds favor a continuation higher. 

On Tuesday, however, price broke out of the rising channel, indicating weakness and that the established uptrend might be faltering. On its own, however, it is not sufficient to indicate a complete reversal lower. 

The overall bias in the short-term is still mildly bullish, however it would now take a close above 144.68 (September 24 high) to provide stronger confirmation of more upside. Tentative targets then lie at 145.00, then 145.50 and finally in a bullish case 146.00. 

The Relative Strength Index (RSI) is showing bearish divergence with price (red dashed line on chart above). Although price was not lower on the September 24 lows compared to the September 20 lows, the RSI was lower, indicating strong downside momentum in the recent sell-off. This could be a sign of underlying weakness.

The pair is in a medium-term downtrend suggesting a risk of a resumption lower, however, those risks are balanced by the fact that it is in a long-term uptrend.

Author

Joaquin Monfort

Joaquin Monfort is a financial writer and analyst with over 10 years experience writing about financial markets and alt data. He holds a degree in Anthropology from London University and a Diploma in Technical analysis.

More from Joaquin Monfort
Share:

Editor's Picks

EUR/USD stays well offered below 1.1800

The selling pressure on EUR/USD is picking up pace, with the pair slipping decisively below the key 1.1800 level and sliding to fresh two week lows as Wednesday’s session draws to a close. The move lower comes as the US Dollar finds renewed strength after the latest round of US data and the release of the FOMC Minutes. Next of note on the docket will be the US weekly Initial Jobless Claims.
 

GBP/USD reaches multi-day lows near 1.3500

GBP/USD reverses its initial upside momentum and is now adding to previous declines, approaching the 1.3500 region on Wednesday. Cable’s downtick comes on the back of decent gains in the Greenback and easing UK inflation figures, which seem to have reinforced the case for a BoE rate cut in March.

Gold battle to regain $5,000 continues

Gold is back on the front foot on Wednesday, shaking off part of the early week softness and challenging two-day highs near the $5,000 mark per troy ounce. The move comes ahead of the FOMC Minutes and is unfolding despite an intense rebound in the US Dollar.

Bitcoin has found or is near a bottom, extended consolidation to follow: K33

Bitcoin (BTC) is nearing or has already established a bottom, which could be followed by a sustained period of slow price movement, according to K33.

Mixed UK inflation data no gamechanger for the Bank of England

Food inflation plunged in January, but service sector price pressure is proving stickier. We continue to expect Bank of England rate cuts in March and June. The latest UK inflation read is a mixed bag for the Bank of England, but we doubt it drastically changes the odds of a March rate cut.

Sui extends sideways action ahead of Grayscale’s GSUI ETF launch

Sui is extending its downtrend for the second consecutive day, trading at 0.95 at the time of writing on Wednesday. The Layer-1 token is down over 16% in February and approximately 34% from the start of the year, aligning with the overall bearish sentiment across the crypto market.