|

USD/JPY Price Analysis: Treads waters below 150.00, focus on US Consumer Sentiment

  • USD/JPY faces a key barrier at 150.00 psychological level.
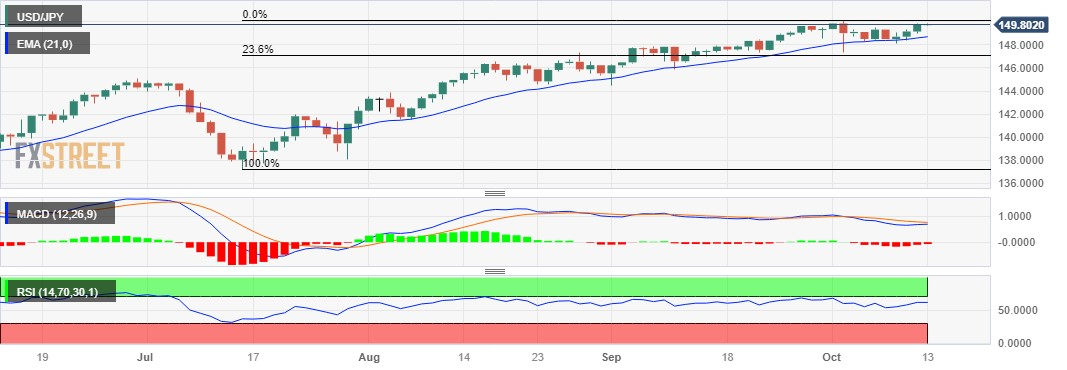
  • MACD indicator suggests a momentum shift towards a bearish trend.
  • The major level at 149.00 emerges as the support, followed by 21-day EMA.

USD/JPY aims to snap the three-day winning streak, trading around 149.80 during the Asian session on Friday, aligned to the major support level at 150.00. The pair received upward support due to the slew of upbeat economic data from the United States (US).

A decisive break above the level could contribute to support for the pair to explore the area around the monthly high at 150.16, followed by the psychological level at 150.50.

On the downside, the USD/JPY pair could find support near the psychological level at 149.00, followed by the 21-day Exponential Moving Average (EMA) at 148.71.

A firm break below the level could put pressure on the pair to navigate the region around the 148.00 level following the 23.6% Fibonacci retracement at the 147.11 level.

The technical analysis for the USD/JPY pair reveals an interesting dynamic. The Moving Average Convergence Divergence (MACD) line being above the centerline indicates a short-term average above the long-term average. However, a significant development is observed as the line is positioned below the signal line, suggesting a shift in momentum toward a bearish trend.

However, the USD/JPY pair maintains a prevailing bullish momentum, highlighting a stronger bias. This is evident in the 14-day Relative Strength Index (RSI) holding above the 50 level, suggesting that the pair has a persistent strength and is still in bullish territory.

USD/JPY: Daily Chart

USD/JPY: additional levels to watch

Overview
Today last price149.8
Today Daily Change-0.01
Today Daily Change %-0.01
Today daily open149.81
 
Trends
Daily SMA20148.8
Daily SMA50147.02
Daily SMA100144.14
Daily SMA200138.78
 
Levels
Previous Daily High149.83
Previous Daily Low148.96
Previous Weekly High150.16
Previous Weekly Low147.32
Previous Monthly High149.71
Previous Monthly Low144.44
Daily Fibonacci 38.2%149.5
Daily Fibonacci 61.8%149.29
Daily Pivot Point S1149.23
Daily Pivot Point S2148.66
Daily Pivot Point S3148.36
Daily Pivot Point R1150.11
Daily Pivot Point R2150.4
Daily Pivot Point R3150.98

Author

Akhtar Faruqui

Akhtar Faruqui is a Forex Analyst based in New Delhi, India. With a keen eye for market trends and a passion for dissecting complex financial dynamics, he is dedicated to delivering accurate and insightful Forex news and analysis.

More from Akhtar Faruqui
Share:

Editor's Picks

AUD/USD languishes near two-month low amid renewed Iran tensions

AUD/USD holds above 0.7000 during the Asian session on Wednesday, though it remains close to a nearly two-month low set the previous day. Fresh US strikes on Iran temper hopes for a peace deal and benefit the safe-haven US Dollar. Furthermore, inflationary concerns continue to fuel hawkish Fed expectations, lending additional support to the buck ahead of the US CPI report. Adding to this, reduced bets on an RBA rate hike in June cap the currency pair.


USD/JPY sits near 160.50 intervention zone as bulls shrug off Japan's strong PPI

USD/JPY consolidates just below mid-160.00s, or its highest level since late April, as economic concerns stemming from the Middle East conflict continue to undermine the Japanese Yen (JPY). Furthermore, a fresh wave of US strikes on Iran benefits the safe-haven US Dollar and acts as a tailwind for the currency pair, countering Japan's hotter-than-expected PPI report. However, intervention fears cap the upside as traders seem hesitant ahead of the US consumer inflation figures later this Wednesday.

Gold flirts with $4,200, lowest since March 23 on hawkish Fed bets

Gold drops to a fresh low since March 23, around the $4,200 mark during the Asian session on Wednesday, as fresh US strikes on Iran fuel inflationary concerns and bolster bets for more hawkish central banks, including the US Fed. Meanwhile, US Dollar bulls are turning cautious ahead of the US CPI report, which could limit bullion losses. However, the recent breakdown below the 200-day SMA suggests that the path of least resistance for the XAU/USD is to the downside.

Bitcoin sell-off pushes over 50% of circulating supply into loss, hinting at market bottom

Bitcoin dropped near $61,000 on Tuesday, with the latest sell-off pushing long-term market indicators toward levels historically associated with bear-market bottoms, according to a report by K33 Research.

When the chips are down, the AI tape starts to shake

The market came into Tuesday trying to sell investors the comforting ”Turnaround Tuesday” idea that Friday’s AI fracture was just another pothole on the road higher. By the close, that story had lost its bid. Monday’s dead cat bounce had done what dead cat bounces always do.

The US economy defies the rules: 100 days into the Oil shock and the recession signal is still missing

More than three months after the start of the Iran war and the resulting disruption to global energy markets, the US economy continues to display remarkable resilience. The conflict has triggered a sharp rise in Oil prices, reignited inflationary pressures and fueled widespread concerns about a potential economic slowdown.