|

USD/JPY Price Analysis: Ready to fly above 140.40 as upbeat US NFP accelerates hawkish Fed bets

  • USD/JPY has comfortably established above 140.00 inspired by upbeat US Employment data.
  • Friday’s upbeat US NFP data have accelerated the odds of more interest rate hikes by the Fed.
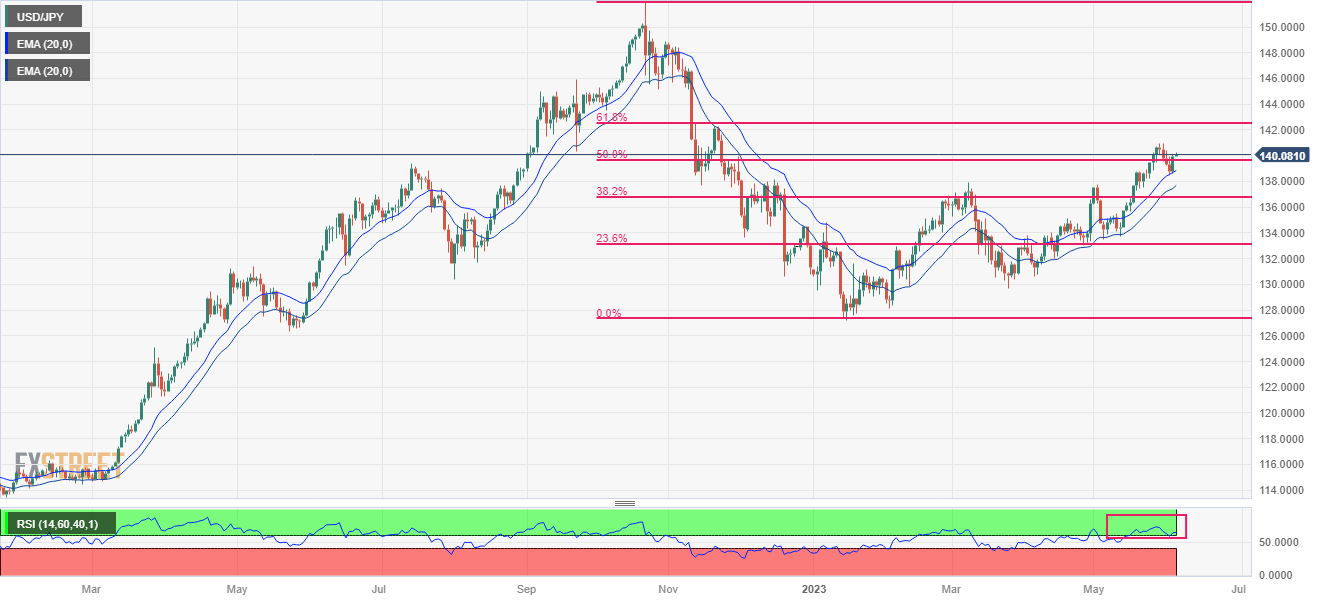
  • USD/JPY has climbed back above the 50% Fibonacci retracement at 139.66.

The USD/JPY pair has shifted its auction comfortably above the crucial resistance of 140.00 in the Asian session. The major is expected to extend its gains firmly as Friday’s upbeat United States Nonfarm Payrolls (NFP) data have accelerated the odds of more interest rate hike announcements by the Federal Reserve (Fed).

S&P500 futures are showing some losses in the Asian session but settled the previous week on a solid note, portraying a minor caution in the overall risk-appetite mood. The US Dollar Index (DXY) is confidently balancing above 104.00 and is expected to extend its upside journey after scrolling above the immediate resistance of 104.20.

On the Japanese Yen front, investors are anticipating that the Bank of Japan (BoJ) could tweak its Yield Curve Control (YCC) to keep monetary policy expansionary.

USD/JPY has climbed back above the 50% Fibonacci retracement (plotted from 21 October 2022 high at 151.94 to 16 January 2023 low at 127.22) at 139.66. The asset has rebounded after finding support near the 20-period (High-Low) Exponential Moving Average (EMA) band.

The Relative Strength Index (RSI) (14) is oscillating in the bullish range of 60.00-80.00, indicating more upside ahead.

Going forward, a break above May 31 high at 140.42 will drive the asset toward May 30 high at 140.93. A break above the latter will expose the asset to a fresh six-month high of around 141.61, which is 23 November 2022 high.

On the flip side, a downside move below March 08 high at 137.92 will drag the asset toward March 02 high at 137.10 followed by a 38.2% Fibo retracement at 136.81.

USD/JPY daily chart

USD/JPY

Overview
Today last price140.09
Today Daily Change0.13
Today Daily Change %0.09
Today daily open139.96
 
Trends
Daily SMA20137.86
Daily SMA50135.32
Daily SMA100133.96
Daily SMA200137.29
 
Levels
Previous Daily High140.07
Previous Daily Low138.6
Previous Weekly High140.93
Previous Weekly Low138.43
Previous Monthly High140.93
Previous Monthly Low133.5
Daily Fibonacci 38.2%139.51
Daily Fibonacci 61.8%139.16
Daily Pivot Point S1139.02
Daily Pivot Point S2138.08
Daily Pivot Point S3137.56
Daily Pivot Point R1140.49
Daily Pivot Point R2141.01
Daily Pivot Point R3141.95

Author

Sagar Dua

Sagar Dua

FXStreet

Sagar Dua is associated with the financial markets from his college days. Along with pursuing post-graduation in Commerce in 2014, he started his markets training with chart analysis.

More from Sagar Dua
Share:

Editor's Picks

EUR/USD looks apathetic around 1.1770

EUR/USD comes under renewed pressure on Tuesday, deflating below the 1.1800 support and reversing two consecutive days of gains. The pair’s decline follows the persistent move higher in the US Dollar, as trade uncertainty dominates the sentiment ahead of President Trump’s SOTU speech.

GBP/USD regains 1.3500 and above

GBP/USD extends its advance for the third day in a row on Tuesday, this time retesting the area beyond the 1.3500 hurdle. Cable’s uptick comes despite decent gains in the Greenback and the dovish message from the BoE’s Bailey at the UK Parliament.

Gold appears offered around $5,150

Gold is giving back a good portion of the recent multi-day rally, receding to the $5,150 zone per troy ounce amid the decent bounce in the US Dollar and mixed US Treasuty yields. In the meantime, markets’ attention remain on upcoming comments from Fed speakers.

Ripple’s DeFi shift in focus: Navigating XRPL EVM sidechain growth, XRPFi migration and liquidity

Ripple (XRP) has continued to trade under pressure, extending its decline by approximately 63% from the record high of $3.66 in July. The remittance token is trading above support at $1.35, while its upside appears limited by key supply zones, starting with $1.40, at the time of writing on Tuesday.

The Citrini report: How a debatable AI narrative can shake Wall Street

That AI-related headline alone was enough to rattle investors.US stocks slid sharply on Monday after a widely circulated Citrini Research memo outlined a hypothetical “2028 Global Intelligence Crisis”, warning that rapid AI adoption could push US unemployment into double digits as early as by mid-2028.

XRP pressured by weak ETF flows and declining retail interest

Ripple (XRP) is edging lower, trading above its intraday low of $1.32 at the time of writing on Tuesday. The decline from its weekly opening of $1.39 reflects heightened volatility in the broader cryptocurrency market, accentuated by tariff-triggered uncertainty.