USD/JPY Price Analysis: Pullback needs validation from 141.00


  • USD/JPY retreats from 11-week-old previous support, snaps four-day downtrend.
  • Convergence of 100-DMA, 50% Fibonacci retracement level challenge bears.
  • Golden ratio appears the key for bearish confirmation, monthly resistance line adds to the upside filters.

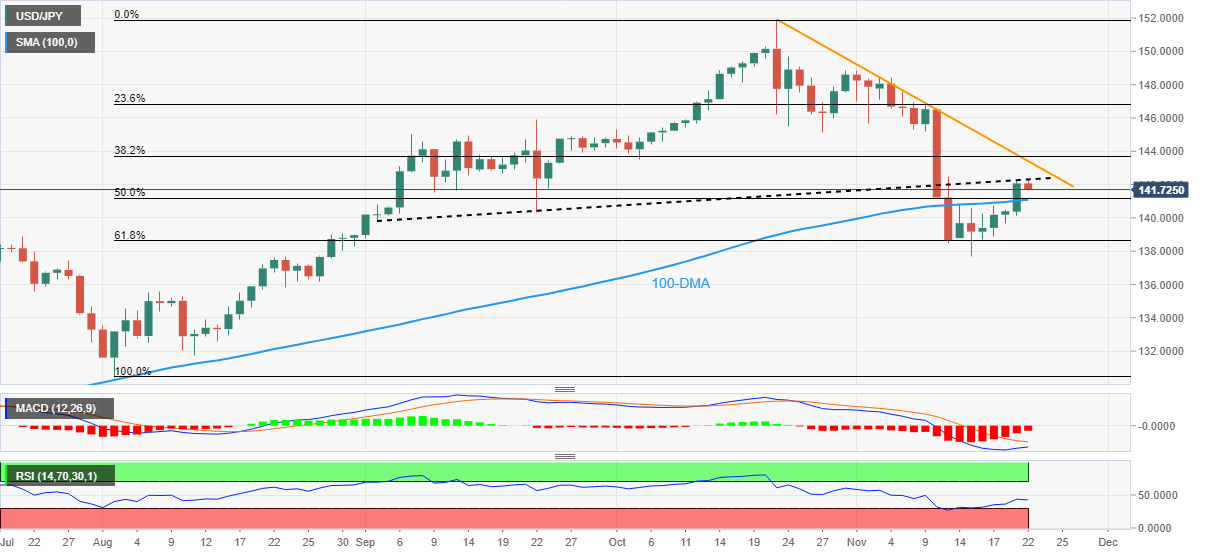
USD/JPY takes offers to refresh intraday low near 141.70 heading into Tuesday’s European session.

In doing so, the Yen pair reverses from the previous support line stretched from early September, around 142.25 by the press time, amid bearish MACD signals.

The pullback moves, however, appear shallow as a confluence of the 100-Day Moving Average (DMA) and the 50% Fibonacci retracement level of the pair’s August-October upside, near the 141.00 round figure, challenge the USD/JPY bears.

Even if the Yen pair sellers dominate past 141.00, the 140.00 threshold and the 61.8% Fibonacci retracement level surrounding 138.60, also known as the Golden Ratio, could restrict the quote’s further downside.

Following that, the early August high near 135.50 could regain the market’s attention.

On the contrary, an upside break of the support-turned-resistance line near 142.25 won’t be an open invitation to the USD/JPY bears as a downwards-sloping resistance line from late October, close to 143.45, could challenge the upside momentum.

In a case where USD/JPY remains firmer past 143.45, multiple hurdles around 145.10 appear the last defense of the pair sellers.

To sum up, USD/JPY retreats from short-term key hurdle but the overall view remains bullish.

USD/JPY: Daily chart

Trend: Limited downside expected

Additional important levels

Overview
Today last price 141.72
Today Daily Change -0.35
Today Daily Change % -0.25%
Today daily open 142.07
 
Trends
Daily SMA20 144.36
Daily SMA50 145.08
Daily SMA100 141.03
Daily SMA200 133.47
 
Levels
Previous Daily High 142.25
Previous Daily Low 140.16
Previous Weekly High 140.8
Previous Weekly Low 137.67
Previous Monthly High 151.94
Previous Monthly Low 143.53
Daily Fibonacci 38.2% 141.45
Daily Fibonacci 61.8% 140.96
Daily Pivot Point S1 140.74
Daily Pivot Point S2 139.41
Daily Pivot Point S3 138.65
Daily Pivot Point R1 142.83
Daily Pivot Point R2 143.59
Daily Pivot Point R3 144.92


Share: Feed news

Information on these pages contains forward-looking statements that involve risks and uncertainties. Markets and instruments profiled on this page are for informational purposes only and should not in any way come across as a recommendation to buy or sell in these assets. You should do your own thorough research before making any investment decisions. FXStreet does not in any way guarantee that this information is free from mistakes, errors, or material misstatements. It also does not guarantee that this information is of a timely nature. Investing in Open Markets involves a great deal of risk, including the loss of all or a portion of your investment, as well as emotional distress. All risks, losses and costs associated with investing, including total loss of principal, are your responsibility. The views and opinions expressed in this article are those of the authors and do not necessarily reflect the official policy or position of FXStreet nor its advertisers. The author will not be held responsible for information that is found at the end of links posted on this page.

If not otherwise explicitly mentioned in the body of the article, at the time of writing, the author has no position in any stock mentioned in this article and no business relationship with any company mentioned. The author has not received compensation for writing this article, other than from FXStreet.

FXStreet and the author do not provide personalized recommendations. The author makes no representations as to the accuracy, completeness, or suitability of this information. FXStreet and the author will not be liable for any errors, omissions or any losses, injuries or damages arising from this information and its display or use. Errors and omissions excepted.

The author and FXStreet are not registered investment advisors and nothing in this article is intended to be investment advice.

Recommended content


Recommended content

Editors’ Picks

EUR/USD edges lower toward 1.0700 post-US PCE

EUR/USD edges lower toward 1.0700 post-US PCE

EUR/USD stays under modest bearish pressure but manages to hold above 1.0700 in the American session on Friday. The US Dollar (USD) gathers strength against its rivals after the stronger-than-forecast PCE inflation data, not allowing the pair to gain traction.

EUR/USD News

GBP/USD retreats to 1.2500 on renewed USD strength

GBP/USD retreats to 1.2500 on renewed USD strength

GBP/USD lost its traction and turned negative on the day near 1.2500. Following the stronger-than-expected PCE inflation readings from the US, the USD stays resilient and makes it difficult for the pair to gather recovery momentum.

GBP/USD News

Gold struggles to hold above $2,350 following US inflation

Gold struggles to hold above $2,350 following US inflation

Gold turned south and declined toward $2,340, erasing a large portion of its daily gains, as the USD benefited from PCE inflation data. The benchmark 10-year US yield, however, stays in negative territory and helps XAU/USD limit its losses. 

Gold News

Bitcoin Weekly Forecast: BTC’s next breakout could propel it to $80,000 Premium

Bitcoin Weekly Forecast: BTC’s next breakout could propel it to $80,000

Bitcoin’s recent price consolidation could be nearing its end as technical indicators and on-chain metrics suggest a potential upward breakout. However, this move would not be straightforward and could punish impatient investors. 

Read more

Week ahead – Hawkish risk as Fed and NFP on tap, Eurozone data eyed too

Week ahead – Hawkish risk as Fed and NFP on tap, Eurozone data eyed too

Fed meets on Wednesday as US inflation stays elevated. Will Friday’s jobs report bring relief or more angst for the markets? Eurozone flash GDP and CPI numbers in focus for the Euro.

Read more

Forex MAJORS

Cryptocurrencies

Signatures