- USD/JPY closes below 150.00 for the first time since March, hitting a five-month low of 148.51.
- Technical indicators show strong downtrend, with RSI suggesting potential for oversold rebound.
- Key resistance at 150.00 and 151.00, with support levels at 148.51, 148.00, and March low of 146.48.
The USD/JPY descended on Thursday trading, breaking below the 150.00 psychological figure and achieving a daily close below the latter for the first time since March. The pair whipsawed in a 200-pip range, sending the Japanese Yen to a five-month high of 148.51. As Friday’s Asian session kicks in, the major trades at 149.34, virtually unchanged.
USD/JPY Price Analysis: Technical outlook
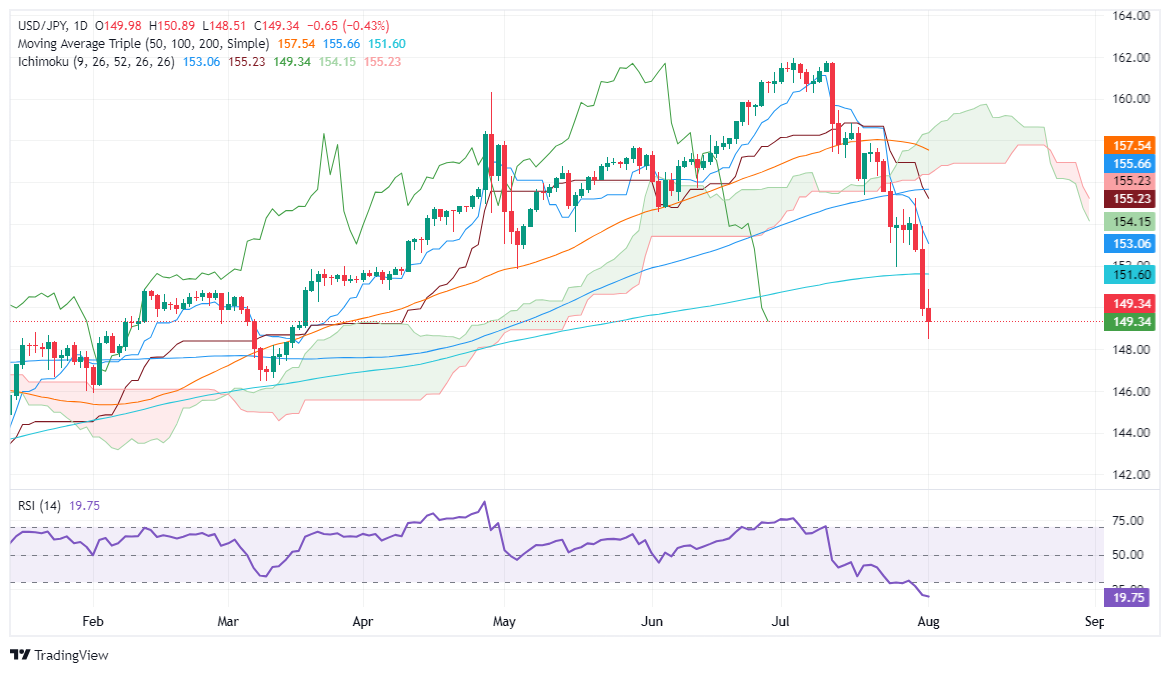
The USD/JPY pair has broken below the 200-day moving average (DMA) and is 500-plus pips below the Ichimoku Cloud (Kumo), confirming a strong downtrend. However, it has begun to show some signs of being overextended.
The Relative Strength Index (RSI) has pierced below the 20 reading, and when that happens on a strong downtrend, RSI becomes oversold meaning the USD/JPY is subject to a mean reversion move.
If USD/JPY climbs past the 150.00 psychological figure, the first resistance would be the 151.00 mark. Once cleared, the 200-DMA emerges as the next resistance at 151.59, ahead of the 152.00 mark.
On the other hand, and the path of least resistance, if the pair drops below 148.51, the next demand zone would be 148.00, and with the Average True Range (ATR) being at 169 pips, the next support would be the March 8 bottom at 146.48.
USD/JPY Price Action – Daily Chart
Japanese Yen PRICE Today
The table below shows the percentage change of Japanese Yen (JPY) against listed major currencies today. Japanese Yen was the strongest against the Australian Dollar.
USD | EUR | GBP | JPY | CAD | AUD | NZD | CHF | |
---|---|---|---|---|---|---|---|---|
USD | -0.01% | 0.00% | -0.03% | -0.02% | 0.04% | 0.02% | 0.00% | |
EUR | 0.00% | 0.00% | 0.00% | -0.04% | 0.05% | 0.01% | 0.02% | |
GBP | -0.01% | -0.00% | -0.04% | -0.03% | 0.03% | 0.00% | 0.03% | |
JPY | 0.03% | 0.00% | 0.04% | 0.01% | 0.06% | 0.02% | 0.05% | |
CAD | 0.02% | 0.04% | 0.03% | -0.01% | 0.06% | 0.06% | 0.06% | |
AUD | -0.04% | -0.05% | -0.03% | -0.06% | -0.06% | -0.02% | -0.01% | |
NZD | -0.02% | -0.01% | 0.00% | -0.02% | -0.06% | 0.02% | 0.03% | |
CHF | -0.00% | -0.02% | -0.03% | -0.05% | -0.06% | 0.01% | -0.03% |
The heat map shows percentage changes of major currencies against each other. The base currency is picked from the left column, while the quote currency is picked from the top row. For example, if you pick the Japanese Yen from the left column and move along the horizontal line to the US Dollar, the percentage change displayed in the box will represent JPY (base)/USD (quote).
Information on these pages contains forward-looking statements that involve risks and uncertainties. Markets and instruments profiled on this page are for informational purposes only and should not in any way come across as a recommendation to buy or sell in these assets. You should do your own thorough research before making any investment decisions. FXStreet does not in any way guarantee that this information is free from mistakes, errors, or material misstatements. It also does not guarantee that this information is of a timely nature. Investing in Open Markets involves a great deal of risk, including the loss of all or a portion of your investment, as well as emotional distress. All risks, losses and costs associated with investing, including total loss of principal, are your responsibility. The views and opinions expressed in this article are those of the authors and do not necessarily reflect the official policy or position of FXStreet nor its advertisers. The author will not be held responsible for information that is found at the end of links posted on this page.
If not otherwise explicitly mentioned in the body of the article, at the time of writing, the author has no position in any stock mentioned in this article and no business relationship with any company mentioned. The author has not received compensation for writing this article, other than from FXStreet.
FXStreet and the author do not provide personalized recommendations. The author makes no representations as to the accuracy, completeness, or suitability of this information. FXStreet and the author will not be liable for any errors, omissions or any losses, injuries or damages arising from this information and its display or use. Errors and omissions excepted.
The author and FXStreet are not registered investment advisors and nothing in this article is intended to be investment advice.
Recommended content
Editors’ Picks

EUR/USD regains traction above 1.1000 ahead of US CPI release
EUR/USD has found fresh buyers and jumps above 1.1000 in the European session on Thursday. The pair gains on the German coalition deal and Trump's 90-day pause on reciprocal tariffs, which have lifted risk senitment while exacerbating the US Dollar pain ahead of the US CPI data release.

GBP/USD trades firm above 1.2850, US CPI data awaited
GBP/USD sustains the rebound above 1.2850 in European trading hours on Thursday. The British Pound capitalizes on risk appetite, courtesy of Trump's tariff pause, allowing the pair to recover ground. But further upside hinges on the US CPI data and US-Sino trade updates.

Gold price enters hotspot region with new all-time high possible
Gold price is delivering a jaw-breaking performance this Thursday in the early trading session, moving around $3,107 at the time of writing. Since Tuesday morning, the precious metal has rallied nearly 5.00%. The main driver for the rally came from the United States President Donald Trump who announced a 90-day pause to higher tariffs on 56 countries and the European Union, which will now be taxed at the 10% baseline rate.

US CPI data set to reveal March inflation dip as markets weigh impact of Trump’s tariffs
As measured by the CPI, inflation in the US is set to rise at an annual pace of 2.6% in March, down slightly from the 2.8% reported in February. Core CPI inflation, which excludes the volatile food and energy categories, is expected to ease to 3% in the same period from a year earlier

Trump’s tariff pause sparks rally – What comes next?
Markets staged a dramatic reversal Wednesday, led by a 12% surge in the Nasdaq and strong gains across major indices, following President Trump’s unexpected decision to pause tariff escalation for non-retaliating trade partners.

The Best brokers to trade EUR/USD
SPONSORED Discover the top brokers for trading EUR/USD in 2025. Our list features brokers with competitive spreads, fast execution, and powerful platforms. Whether you're a beginner or an expert, find the right partner to navigate the dynamic Forex market.