|

USD/JPY Price Analysis: Extends downside to 150.00 as USD Index drops to weekly low

  • USD/JPY falls to near 150.00 amid a sell-off in the USD Index.
  • Fed policymakers warned that over-focusing on a one-time inflation increase could be a tremendous mistake.
  • The BoJ may postpone plans of exiting the expansionary monetary policy stance.

The USD/JPY pair falls slightly below the psychological support of 150.00 in the early New York session on Tuesday. The asset has faced selling pressure as the US Dollar Index (DXY) has extended its downside to 104.00.

The USD Index has dropped to a weekly low as Federal Reserve (Fed) policymakers are confident that inflation is in the right direction despite a one-time stubborn-than-anticipated consumer price inflation data for January.

Fed policymakers advised that over-focusing on one-time blips in inflation data could be a tremendous mistake. As per the CME FedWatch tool, investors see interest rates remaining unchanged in the range of 5.25%-5.50% till the July policy meeting as the Fed needs more good inflation data for months.

The Japanese Yen performs better against the US Dollar despite easing hopes for the Bank of Japan (BoJ) quitting the decade-long ultra-dovish monetary policy stance. The Japanese Yen entered a recession in the second half of 2023. The situation of a poor domestic economy is an unfavorable situation for exiting the expansionary policy stance.

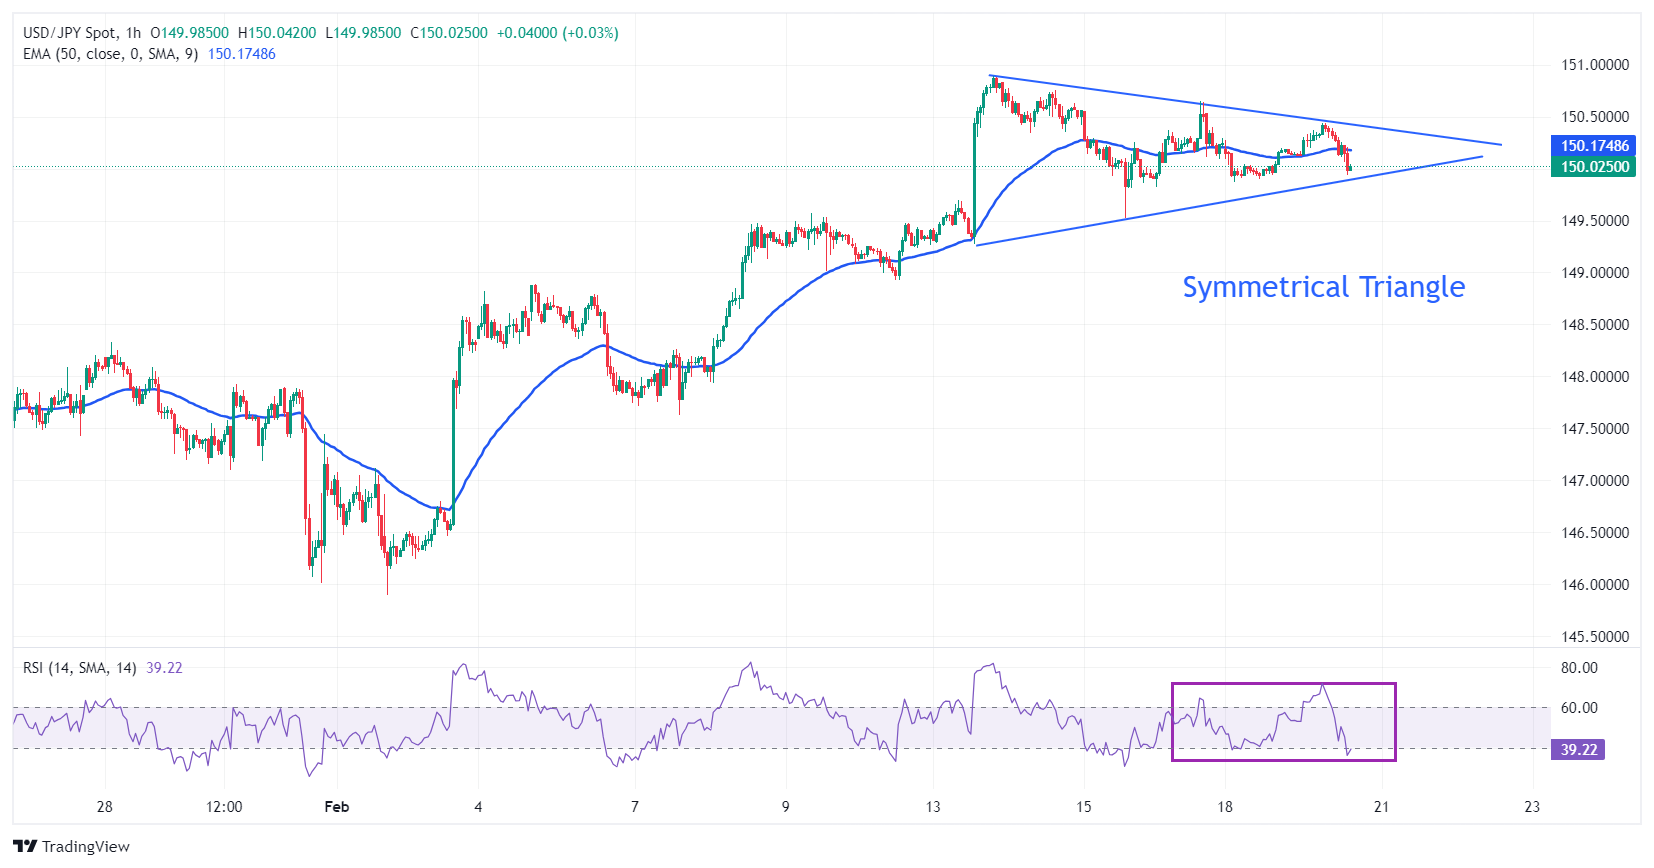
USD/JPY oscillates in a Symmetrical Triangle formation on an hourly time frame. The upward and downward-sloping borders of the aforementioned chart pattern are plotted from February 13 low and high at 149.27 and 150.88, respectively.

The triangle could breakout in either direction, however, the odds marginally favor a move in the direction of the trend before the formation of the triangle – in this case up.

The 50-period Exponential Moving Average (EMA) around 150.20 remains sticky to spot prices, indicates indecisiveness among market participants.

Going forward, a decisive break above February 13 high at 150.88 would drive the asset towards November 16 high at 151.43, followed by November 13 high at 151.90.

On the flip side, a breakdown below February 13 high at 149.27 would drag the asset towards February 5 high at 148.90. Breach of the latter would expose the asset to January 29 high at 148.32.

USD/JPY hourly chart

USD/JPY

Overview
Today last price149.95
Today Daily Change-0.19
Today Daily Change %-0.13
Today daily open150.14
 
Trends
Daily SMA20148.65
Daily SMA50145.91
Daily SMA100147.57
Daily SMA200145.43
 
Levels
Previous Daily High150.28
Previous Daily Low149.88
Previous Weekly High150.89
Previous Weekly Low148.93
Previous Monthly High148.81
Previous Monthly Low140.81
Daily Fibonacci 38.2%150.03
Daily Fibonacci 61.8%150.12
Daily Pivot Point S1149.92
Daily Pivot Point S2149.7
Daily Pivot Point S3149.52
Daily Pivot Point R1150.32
Daily Pivot Point R2150.5
Daily Pivot Point R3150.72

Author

Sagar Dua

Sagar Dua

FXStreet

Sagar Dua is associated with the financial markets from his college days. Along with pursuing post-graduation in Commerce in 2014, he started his markets training with chart analysis.

More from Sagar Dua
Share:

Editor's Picks

EUR/USD holds losses below 1.1850 ahead of FOMC Minutes

EUR/USD stays on the back foot below 1.1850 in the European session on Wednesday, pressured by renewed US Dollar demand and reports that ECB President Lagarde will step down before the end of her term. Traders now look forward to the Minutes of the Fed's January monetary policy meeting for fresh signals on future rate cuts. 

GBP/USD defends 1.3550 after UK inflation data

GBP/USD is holding above 1.3550 in Wednesday's European morning, little changed following the UK Consumer Price Index (CPI) data release. The UK inflation eased as expected in January, reaffirming bets for a March BoE interest rate cut, especially after Tuesday's weak employment report. 

Gold retains bullish bias amid Fed rate cut bets, ahead of Fed Minutes

Gold sticks to modest intraday gains through the early European session, reversing a major part of the previous day's heavy losses of more than 2%, to the $4,843-4,842 region or a nearly two-week low. That said, the fundamental backdrop warrants caution for bulls ahead of the FOMC Minutes, which will look for more cues about the US Federal Reserve's rate-cut path. 

Pi Network rally defies market pressure ahead of its first anniversary

Pi Network is trading above $0.1900 at press time on Wednesday, extending the weekly gains by nearly 8% so far. The steady recovery is supported by a short-term pause in mainnet migration, which reduces pressure on the PI token supply for Centralized Exchanges. The technical outlook focuses on the $0.1919 resistance as bullish momentum increases.

Mixed UK inflation data no gamechanger for the Bank of England

Food inflation plunged in January, but service sector price pressure is proving stickier. We continue to expect Bank of England rate cuts in March and June. The latest UK inflation read is a mixed bag for the Bank of England, but we doubt it drastically changes the odds of a March rate cut.

Top 3 Price Prediction: Bitcoin, Ethereum, and Ripple face downside risk as bears regain control

Bitcoin, Ethereum, and Ripple remain under pressure on Wednesday, with the broader trend still sideways. BTC is edging below $68,000, nearing the lower consolidating boundary, while ETH and XRP also declined slightly, approaching their key supports.