|

USD/JPY Price Analysis: Drops to an eight-week low, hovers around 147.50

  • USD/JPY moves on the downward trajectory to an eight-week low.
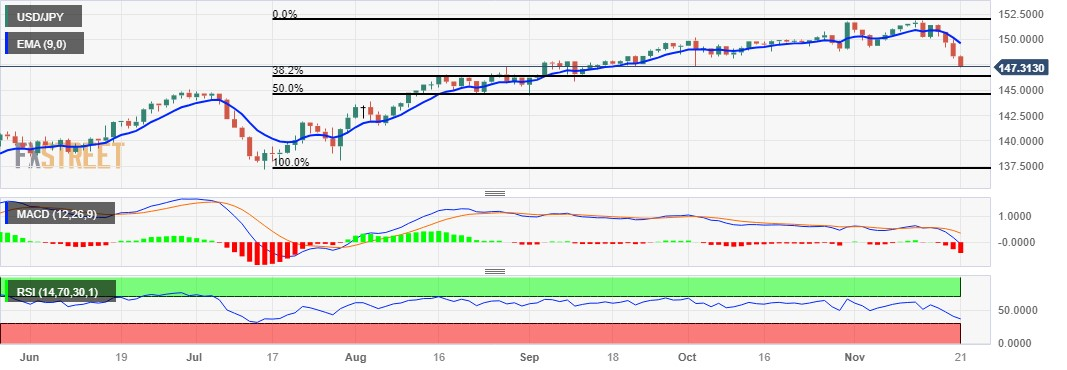
  • 147.00 psychological level appears to be a key support following the 38.2% Fibonacci retracement.
  • A breakthrough above the 148.00 level could support the pair to explore the region near the nine-day EMA.

USD/JPY extended the losing streak that began on Thursday and marked an eight-week low, trading around 147.40 during the European session on Tuesday. The 147.00 psychological level emerges as the immediate support following the 38.2% Fibonacci retracement at 146.32.

The US Dollar (USD) has plunged to a nearly three-month low, influenced by dovish expectations from the Federal Reserve (Fed). This development is a significant factor contributing to the decline of the USD/JPY pair.

The 14-day Relative Strength Index (RSI) lies below the 50 level, signaling a weaker sentiment for the USD/JPY pair. This could potentially prompt bearish movements toward the psychological support region around 146.00. If a decisive break occurs below this level, it may pave the way for the USD/JPY pair to navigate the area near the 50.0% retracement at the 144.60 level.

Moreover, the Moving Average Convergence Divergence (MACD) line is positioned below the centerline and diverges below the signal line, signaling a bearish momentum in the market for the USD/JPY pair.

On the upside, the major level at 147.50 serves as the immediate barrier, followed by the psychological level at 148.00. A breakthrough above the latter could provide support for the USD/JPY pair to explore the region around the 149.00 level following the nine-day Exponential Moving Average (EMA) at 149.62.

USD/JPY: Daily Chart

USD/JPY: More technical levels to watch

Overview
Today last price147.45
Today Daily Change-0.89
Today Daily Change %-0.60
Today daily open148.34
 
Trends
Daily SMA20150.41
Daily SMA50149.49
Daily SMA100146.54
Daily SMA200141.47
 
Levels
Previous Daily High149.99
Previous Daily Low148.1
Previous Weekly High151.91
Previous Weekly Low149.2
Previous Monthly High151.72
Previous Monthly Low147.32
Daily Fibonacci 38.2%148.82
Daily Fibonacci 61.8%149.27
Daily Pivot Point S1147.63
Daily Pivot Point S2146.92
Daily Pivot Point S3145.74
Daily Pivot Point R1149.52
Daily Pivot Point R2150.7
Daily Pivot Point R3151.41

Author

Akhtar Faruqui

Akhtar Faruqui is a Forex Analyst based in New Delhi, India. With a keen eye for market trends and a passion for dissecting complex financial dynamics, he is dedicated to delivering accurate and insightful Forex news and analysis.

More from Akhtar Faruqui
Share:

Markets move fast. We move first.

Orange Juice Newsletter brings you expert driven insights - not headlines. Every day on your inbox.

By subscribing you agree to our Terms and conditions.

Editor's Picks

EUR/USD posts modest gains above 1.1700 as ECB signals pause

The EUR/USD pair posts modest gains around 1.1710 during the early Asian session on Monday. The Euro strengthens against the Greenback after the European Central Bank left its policy rates unchanged and took a more positive view on the Eurozone economy, which has shown resilience to global trade shocks. Financial markets are likely to remain subdued as traders book profits ahead of the long holiday period.

GBP/USD steadies below 1.3400 as traders assess BoE policy outlook

Following Thursday's volatile session, GBP/USD moves sideways below 1.3400 on Friday. Investors reassess the Bank of England's policy oıtlook after the MPC decided to cut the interest rate by 25 bps by a slim margin. Meanwhile, the improving risk mood helps the pair hold its ground.

Gold advances above $4,350 amid renewed geopolitical tensions

Gold is rising back above $4,350 early Monday, helped by renewed geopolitical tensions. Israel-Iran conflict and US-Venezuela headlines drive investors toward the traditional store of value, Gold. 

Week ahead: Key risks to watch in last days of 2025 and early 2026

The festive period officially starts next week, with many traders vacating their desks until the first full week of January, making way for thin trading volumes and very few top-tier releases.

How much can one month of soft inflation change the Fed’s mind?

One month of softer inflation data is rarely enough to shift Federal Reserve policy on its own, but in a market highly sensitive to every data point, even a single reading can reshape expectations. November’s inflation report offered a welcome sign of cooling price pressures. 

XRP rebounds amid ETF inflows and declining retail demand demand

XRP rebounds as bulls target a short-term breakout above $2.00 on Friday. XRP ETFs record the highest inflow since December 8, signaling growing institutional appetite.