|

USD/JPY hung up near 150.50 after Greenback gains for a second day

  • The USD/JPY is edging higher, retesting chart space above 150.00.
  • Bullish momentum appears to be weakening as the pair struggles to reclaim 151.70.
  • Fed Chair Powell makes an appearance on Wednesday, Japan Current Account early Thursday.

The USD/JPY is trading into the 150.50 neighborhood after the pair eked out a second straight day of gains following last week's three-day decline into 149.20.

The US Dollar (USD) bulled into 151.72 last Tuesday, a mere 20 pips away from hitting a new 31-year high against the Japanese Yen (JPY) as a stubbornly-dovish Bank of Japan (BoJ) continues to hang the JPY out to dry in favor of maintaining hyper-easy monetary policy, and broad-market risk-off flows continue to prop up the Greenback in safe haven flights.

Forex Today: Dollar's rebound loses momentum; yields remain volatile

Wednesday sees an appearance from Federal Reserve (Fed) Chairman Jerome Powell, who will be speaking at the Division of Research and Statistics Centennial Conference in Washington, DC, and investors will be keeping a close eye on the Fed head looking for hints about the Fed's perspective following last Friday's 30-month low print for the US Nonfarm Payrolls (NFP) jobs report.

Japanese Trade Balance figures will be printing in the early Asia market session for Thursday, and markets are expecting the headline non-seasonally-adjusted Current Account for September to continue growing. The MoM figure is forecast to print at ¥3,000.8 billion compared to August's ¥2,279.7 billion.

USD/JPY Technical Outlook

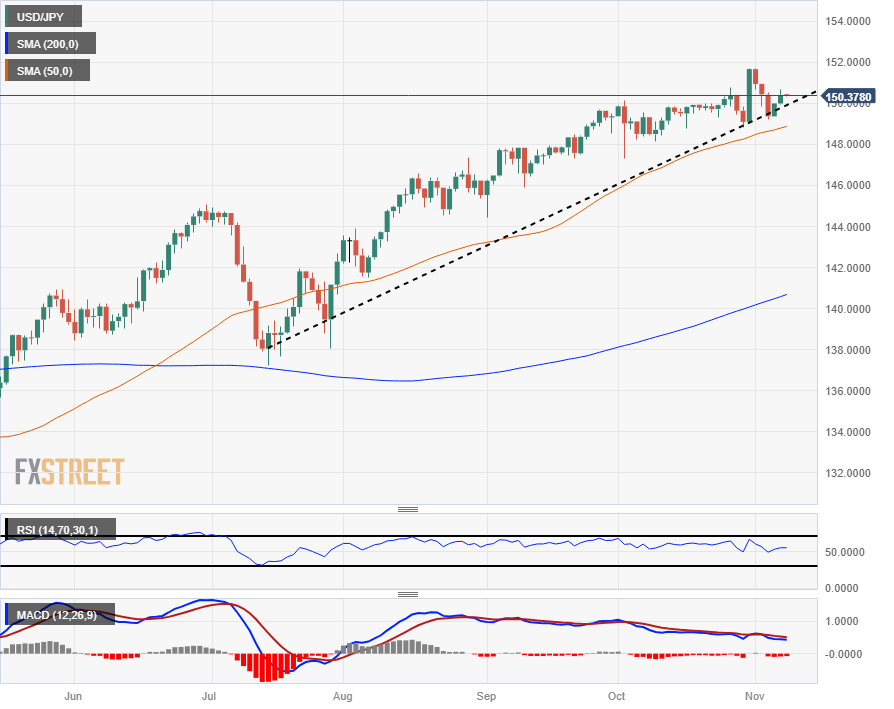
The USD/JPY continues to grind higher on the daily candlesticks, and the pair is catching some technical lift in a bounce off of a rising trendline from July's swing lows into the 138.00 handle.

Downside pressure sees rising support from the 50-day Simple Moving Average (SMA) currently rising into the 149.00 region.

On the top side, technical resistance is mounting after last week's peak just south of 152.00, and bidders appear to be running out of gas in the near-term, though the long-term trend remains firmly bullish with the 200-day SMA far below chart action near 141.00.

USD/JPY Daily Chart

USD/JPY Technical Levels

USD/JPY

Overview
Today last price150.38
Today Daily Change0.38
Today Daily Change %0.25
Today daily open150
 
Trends
Daily SMA20149.88
Daily SMA50148.71
Daily SMA100145.83
Daily SMA200140.48
 
Levels
Previous Daily High150
Previous Daily Low149.35
Previous Weekly High151.72
Previous Weekly Low148.81
Previous Monthly High151.72
Previous Monthly Low147.32
Daily Fibonacci 38.2%149.75
Daily Fibonacci 61.8%149.6
Daily Pivot Point S1149.57
Daily Pivot Point S2149.14
Daily Pivot Point S3148.92
Daily Pivot Point R1150.22
Daily Pivot Point R2150.43
Daily Pivot Point R3150.86

(The story was corrected on November 8 at 01:05 GMT to say, in the last paragraph, that last week's peak just south of 152.00, not 1152.00.)

Author

Joshua Gibson

Joshua joins the FXStreet team as an Economics and Finance double major from Vancouver Island University with twelve years' experience as an independent trader focusing on technical analysis.

More from Joshua Gibson
Share:

Editor's Picks

GBP/USD bounces off lows, back above 1.3200

After bottoming out near 1.3160, GBP/USD manages to regain a bit of shine and reclaim the 1.3200 mark and beyond at the end of the week. Stronger-than-expected UK Retail Sales data seem to be helping the British Pound limit its losses, while the chaotic UK political environment keeps the bulls at bay for now.

EUR/USD looks consolidative around 1.1460

EUR/USD stages a modest rebound after slipping to a three-month low below 1.1420 at the end of the week. That said, the pair now looks to consolidate humble gains just above 1.1460 despite growing uncertainty surrounding the next round of US-Iran negotiations, which keeps the US Dollar’s downside contained.

Gold slips back to six-day lows, targets $4,100

Gold retreats for the third consecutive day on Friday, eroding gains seen in the first half of the week and approaching the key $4,100 mark per troy ounce. Indeed, the precious metal continues to face headwinds from the Fed's hawkish stance and renewed uncertainty surrounding the next round of US-Iran negotiations.

Breaking: Iran closes the Strait of Hormuz amid ceasefire deal violation
Iran says it is closing the Strait of Hormuz after accusing the United States (US) and Israel of violating the ceasefire. According to Iran, the decision came over the continued Israeli strikes in Lebanon. The Iranian Revolutionary Guard Corps Navy issued a warning to all vessels: "Do not approach the Strait of Hormuz; otherwise, your security will be jeopardized."
The Iran war didn't break the US economy, but what happens next?

Nearly four months after the start of the Iran war, the US economy remains remarkably resilient. While the conflict initially triggered a severe disruption to global energy markets and a sharp rise in Oil prices, recent diplomatic progress between Washington and Tehran has eased concerns about a prolonged supply shock.

Regime change: Inside Kevin Warsh's first move to make the Fed unreadable on purpose

The rate did not move. That was the least interesting thing about Kevin Warsh's first meeting in charge of the Fed. The FOMC held its benchmark at 3.50%-3.75% for the fourth straight meeting, exactly as priced, and then the new chair used his first press conference to dismantle the machinery the market has leaned on for a decade.