|

USD/INR technical analysis: Sellers eye 3-week old support-line as MACD about to turn bearish

  • USD/INR remains firm above near-term support-line but fails to clear 61.8% Fibonacci retracement.
  • MACD is about to flash bearish signal, highlighting the importance of immediate trend-line support and 21-DMA.

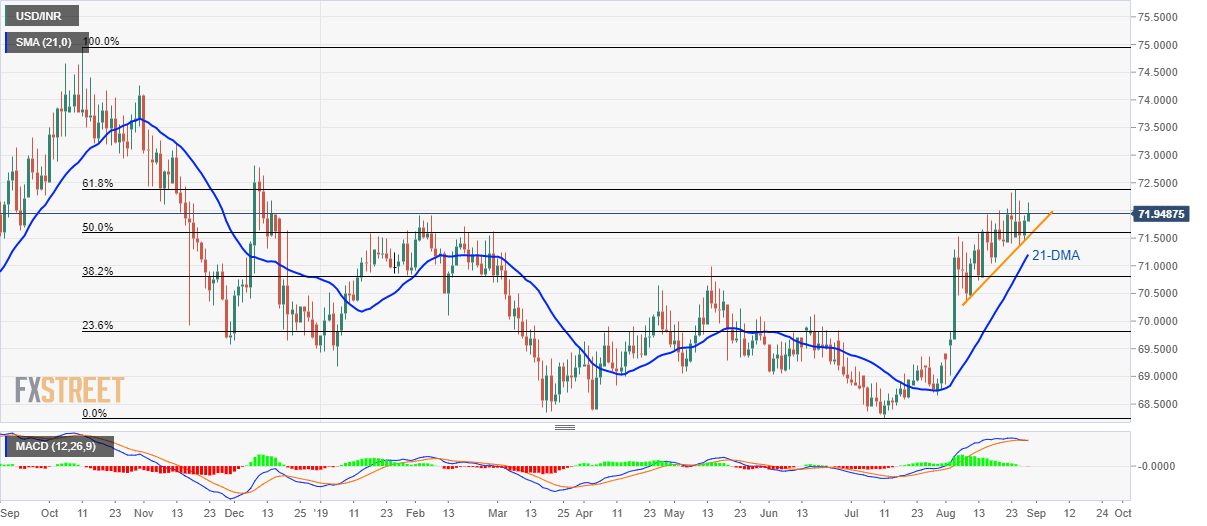
The USD/INR pair’s failure to rise past-61.8% Fibonacci retracement of 2018 peak to current year bottom will soon be joined by a bearish signal from the 12-day moving average convergence and divergence (MACD) as it makes the rounds to 71.95 ahead of Thursday’s European session.

As a result, the quote might witness a pullback towards three-week-old support-line, at 71.52, whereas 21-day simple moving average (DMA) could restrict the pair’s further declines around 71.20.

In a case where prices fail to respect 71.20 mark, 38.2% Fibonacci retracement level of 70.80 and June month high surrounding 70.12 can lure USD/INR sellers.

On the upside break of 61.8% Fibonacci retracement level near 72.40, prices can rise to December 2018 high of 72.82.

USD/INR daily chart

Trend: pullback expected

Additional important levels

Overview
Today last price71.9455
Today Daily Change0.1198
Today Daily Change %0.17%
Today daily open71.8257
 
Trends
Daily SMA2071.1652
Daily SMA5069.798
Daily SMA10069.7254
Daily SMA20070.0684
Levels
Previous Daily High71.905
Previous Daily Low71.4525
Previous Weekly High72.3235
Previous Weekly Low71.06
Previous Monthly High69.3675
Previous Monthly Low68.2475
Daily Fibonacci 38.2%71.7321
Daily Fibonacci 61.8%71.6254
Daily Pivot Point S171.5505
Daily Pivot Point S271.2752
Daily Pivot Point S371.098
Daily Pivot Point R172.003
Daily Pivot Point R272.1802
Daily Pivot Point R372.4555

Author

Anil Panchal

Anil Panchal

FXStreet

Anil Panchal has nearly 15 years of experience in tracking financial markets. With a keen interest in macroeconomics, Anil aptly tracks global news/updates and stays well-informed about the global financial moves and their implications.

More from Anil Panchal
Share:

Markets move fast. We move first.

Orange Juice Newsletter brings you expert driven insights - not headlines. Every day on your inbox.

By subscribing you agree to our Terms and conditions.

Editor's Picks

EUR/USD holds around 1.1750 after weak German and EU PMI data

EUR/USD maintains its range trade at around 1.1750 in European trading on Tuesday. Weaker-than-expected December PMI data from Germany and the Eurozone make it difficult for the Euro to find demand, while investors refrain from taking large USD positions ahead of key employment data.

GBP/USD climbs above 1.3400 after upbeat UK PMI data

GBP/USD gains traction and trades in positive territory above 1.3400 on Tuesday as the British Pound benefits from upbeat PMI data. Later in the day, crucial data releases from the US, including Nonfarm Payrolls, Retail Sales and PMI, could trigger the next big action in the pair.

Gold retreats from seven week highs on profit-taking; all eyes on US NFP release

Gold price loses momentum below $4,300 during the early European trading hours on Tuesday, pressured by some profit-taking and weak long liquidation from the shorter-term futures traders. Furthermore, optimism around Ukraine peace talks could weigh on the safe-haven asset like Gold.

US Nonfarm Payrolls expected to point to cooling labor market in November

The United States Bureau of Labor Statistics will release the delayed Nonfarm Payrolls (NFP) data for October and November on Tuesday at 13:30 GMT. Economists expect Nonfarm Payrolls to rise by 40,000 in November. The Unemployment Rate is likely to remain unchanged at 4.4% during the same period.

NFP preview: Complex data release will determine if Fed was right to cut rates

The long wait is over, and the Bureau of Labor Statistics in the US will release nonfarm payrolls reports for both November and October at 1330 GMT on Tuesday. The overall NFP figure for October is expected to be -10k, however, it is expected to be influenced by a massive 130k drop in federal department workers. 

BNB Price Forecast: BNB slips below $855 as bearish on-chain signals and momentum indicators turn negative

BNB, formerly known as Binance Coin, continues to trade down around $855 at the time of writing on Tuesday, after a slight decline the previous day. Bearish sentiment further strengthens as BNB’s on-chain and derivatives data show rising retail activity.