- USD/INR awaits fresh clues after Wednesday’s pullback from key resistance.
- 38.2% Fibonacci retracement, ascending trend line since July in focus.
- Multiple barriers on the upside before 73.00 round-figure.
USD/INR stays modestly changed to 71.48 amid the initial Indian session on Thursday. The pair dropped towards retesting the weekly low of 71.35, flashed yesterday, as taking rounds to 71.38 at the open. However, mild recoveries could be spotted after a heavy fall the previous.
Read: Moody’s: India's fiscal flexibility hindered by high debt burden, weak debt affordability
Even so, the pair stays on the back foot while reversing from a downward sloping trend line since mid-December 2018, also observing the declines below 50% Fibonacci retracement level of October 2018 to July 2019 fall.
With this, USD/INR prices are likely to keep the losses while targeting 71.00 and 38.2% Fibonacci retracement level of 70.80. However, an upward sloping trend line since July 2019, near 70.72, can cure the pair’s further weakness ahead of 70.00 psychological magnet.
On the upside, 72.00 can offer immediate resistance ahead of 61.8% Fibonacci retracement, at 72.40, also prior to challenging the multi-month-old resistance line that currency stays near 72.57.
In a case where buyers manage to take-out the 72.57 mark, December 2018 top surrounding 72.82 will hold the keys to pair’s rise towards 73.00.
USD/INR weekly chart
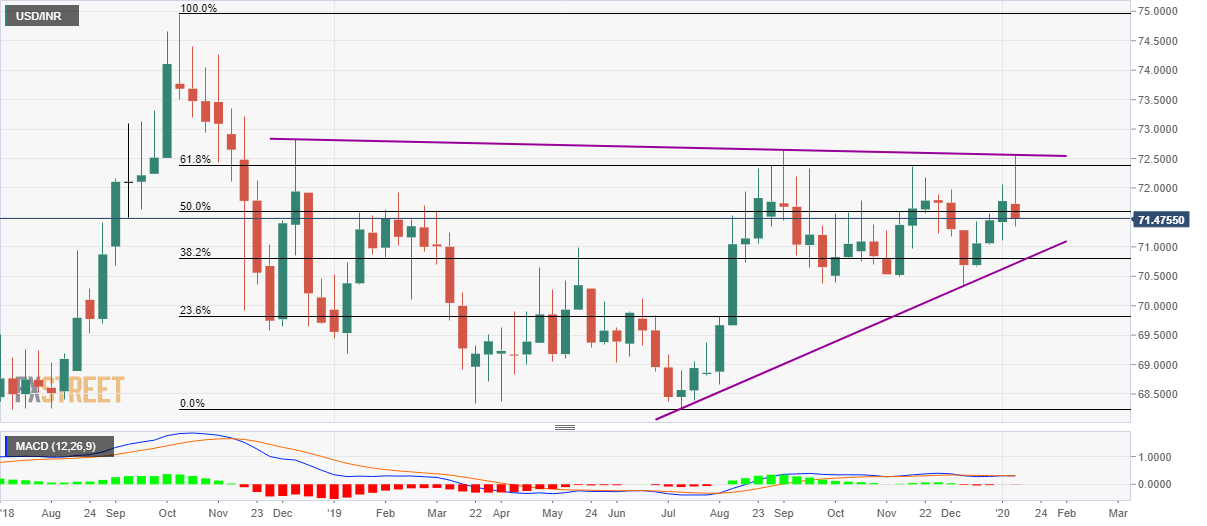
Trend: Pullback expected
Information on these pages contains forward-looking statements that involve risks and uncertainties. Markets and instruments profiled on this page are for informational purposes only and should not in any way come across as a recommendation to buy or sell in these assets. You should do your own thorough research before making any investment decisions. FXStreet does not in any way guarantee that this information is free from mistakes, errors, or material misstatements. It also does not guarantee that this information is of a timely nature. Investing in Open Markets involves a great deal of risk, including the loss of all or a portion of your investment, as well as emotional distress. All risks, losses and costs associated with investing, including total loss of principal, are your responsibility. The views and opinions expressed in this article are those of the authors and do not necessarily reflect the official policy or position of FXStreet nor its advertisers. The author will not be held responsible for information that is found at the end of links posted on this page.
If not otherwise explicitly mentioned in the body of the article, at the time of writing, the author has no position in any stock mentioned in this article and no business relationship with any company mentioned. The author has not received compensation for writing this article, other than from FXStreet.
FXStreet and the author do not provide personalized recommendations. The author makes no representations as to the accuracy, completeness, or suitability of this information. FXStreet and the author will not be liable for any errors, omissions or any losses, injuries or damages arising from this information and its display or use. Errors and omissions excepted.
The author and FXStreet are not registered investment advisors and nothing in this article is intended to be investment advice.
Recommended content
Editors’ Picks
EUR/USD clings to gains above 1.0750 after US data

EUR/USD manages to hold in positive territory above 1.0750 despite retreating from the fresh multi-week high it set above 1.0800 earlier in the day. The US Dollar struggles to find demand following the weaker-than-expected NFP data.
GBP/USD declines below 1.2550 following NFP-inspired upsurge

GBP/USD struggles to preserve its bullish momentum and trades below 1.2550 in the American session. Earlier in the day, the disappointing April jobs report from the US triggered a USD selloff and allowed the pair to reach multi-week highs above 1.2600.
Gold struggles to hold above $2,300 despite falling US yields

Gold stays on the back foot below $2,300 in the American session on Friday. The benchmark 10-year US Treasury bond yield stays in negative territory below 4.6% after weak US data but the improving risk mood doesn't allow XAU/USD to gain traction.
Bitcoin Weekly Forecast: Should you buy BTC here? Premium

Bitcoin (BTC) price shows signs of a potential reversal but lacks confirmation, which has divided the investor community into two – those who are buying the dips and those who are expecting a further correction.
Week ahead – BoE and RBA decisions headline a calm week

Bank of England meets on Thursday, unlikely to signal rate cuts. Reserve Bank of Australia could maintain a higher-for-longer stance. Elsewhere, Bank of Japan releases summary of opinions.