|

USD/INR technical analysis: On a defensive around 10-DMA, 61.8% Fibo.

  • Failure to rise past-71.60 drags USD/INR downward.
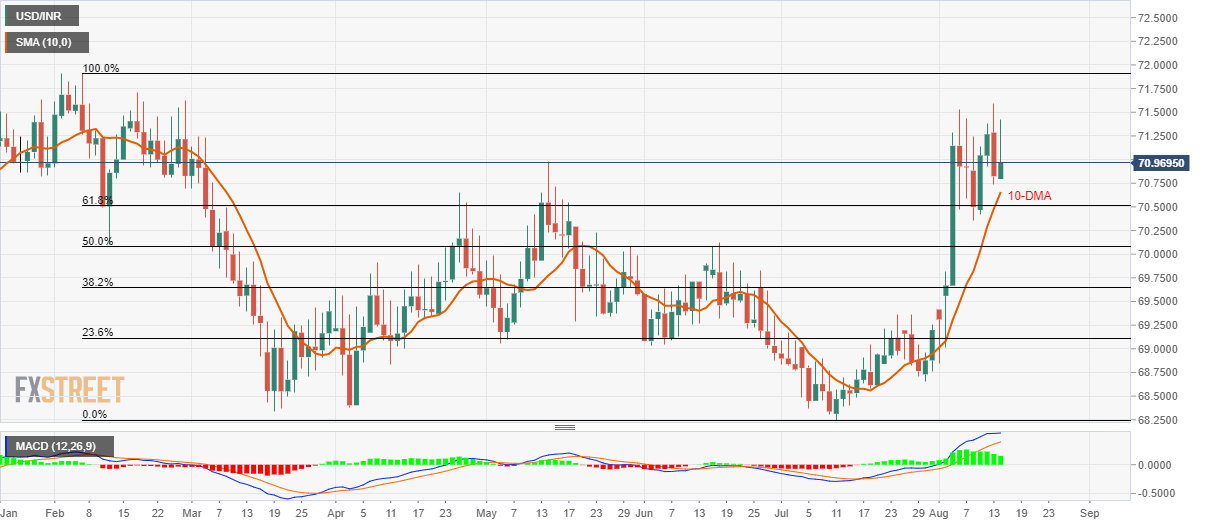
  • 10-DMA, 61.8% of Fibonacci retracement seem the key supports.

Despite being on the back foot, USD/INR remains supported by near-term key technical levels as it makes the rounds to 71.00 heading into European session open on Wednesday.

Among the immediate supports, 10-day simple moving average (DMA) level of 70.66 becomes the closest rest ahead of dragging the quote to 61.8% Fibonacci retracement level of February to July downpour, at 70.50.

Should prices slip below 70.50, 50% Fibonacci retracement and June month high can please sellers around 70.12/07.

On the upside, 71.60 holds the gate for the pair’s run-up towards 72.00 round-figure whereas December 2018 high around 72.80 could be next on bears’ watch.

USD/INR daily chart

Trend: Pullback expected

Additional important levels

Overview
Today last price71.0102
Today Daily Change0.1862
Today Daily Change %0.26%
Today daily open70.824
 
Trends
Daily SMA2069.691
Daily SMA5069.3405
Daily SMA10069.4512
Daily SMA20070.0954
Levels
Previous Daily High71.59
Previous Daily Low70.735
Previous Weekly High71.53
Previous Weekly Low69.6669
Previous Monthly High69.3675
Previous Monthly Low68.2475
Daily Fibonacci 38.2%71.0616
Daily Fibonacci 61.8%71.2634
Daily Pivot Point S170.5093
Daily Pivot Point S270.1947
Daily Pivot Point S369.6543
Daily Pivot Point R171.3643
Daily Pivot Point R271.9047
Daily Pivot Point R372.2193

Author

Anil Panchal

Anil Panchal

FXStreet

Anil Panchal has nearly 15 years of experience in tracking financial markets. With a keen interest in macroeconomics, Anil aptly tracks global news/updates and stays well-informed about the global financial moves and their implications.

More from Anil Panchal
Share:

Editor's Picks

EUR/USD meets initial support around 1.1800

EUR/USD remains on the back foot, although it has managed to reverse the initial strong pullback toward the 1.1800 region and regain some balance, hovering around the 1.1850 zone as the NA session draws to a close on Tuesday. Moving forward, market participants will now shift their attention to the release of the FOMC Minutes and US hard data on Wednesday.
 

GBP/USD bounces off lows, retargets 1.3550

After bottoming out just below the 1.3500 yardstick, GBP/USD now gathers some fresh bids and advances to the 1.3530-1.3540 band in the latter part of Tuesday’s session. Cable’s recovery comes as the Greenback surrenders part of its advance, although it keeps the bullish bias well in place for the day.

Gold remains offered below $5,000

Gold stays on the defensive on Tuesday, receding to the sub-$5,000 region per troy ounce on the back of the persistent move higher in the Greenback. The precious metal’s decline is also underpinned by the modest uptick in US Treasury yields across the spectrum.

Ethereum Price Forecast: BitMine extends ETH buying streak, says long-term outlook remains positive

Ethereum (ETH) treasury firm BitMine Immersion continued its weekly purchase of the top altcoin last week after acquiring 45,759 ETH.

UK jobs market weakens, bolstering rate cut hopes

In the UK, the latest jobs report made for difficult reading. Nonetheless, this represents yet another reminder for the Bank of England that they need to act swiftly given the collapse in inflation expected over the coming months. 

Ripple slides to $1.45 as downside risks surge

Ripple edges lower at the time of writing on Tuesday, from the daily open of $1.48, as headwinds persist across the crypto market. A short-term support is emerging at $1.45, but a buildup of bearish positions could further weaken the derivatives market and prolong the correction.