USD/INR technical analysis: Bearish MACD directs sellers to 100/200-day SMA


  • USD/INR pulls back from one week high amid bearish MACD.
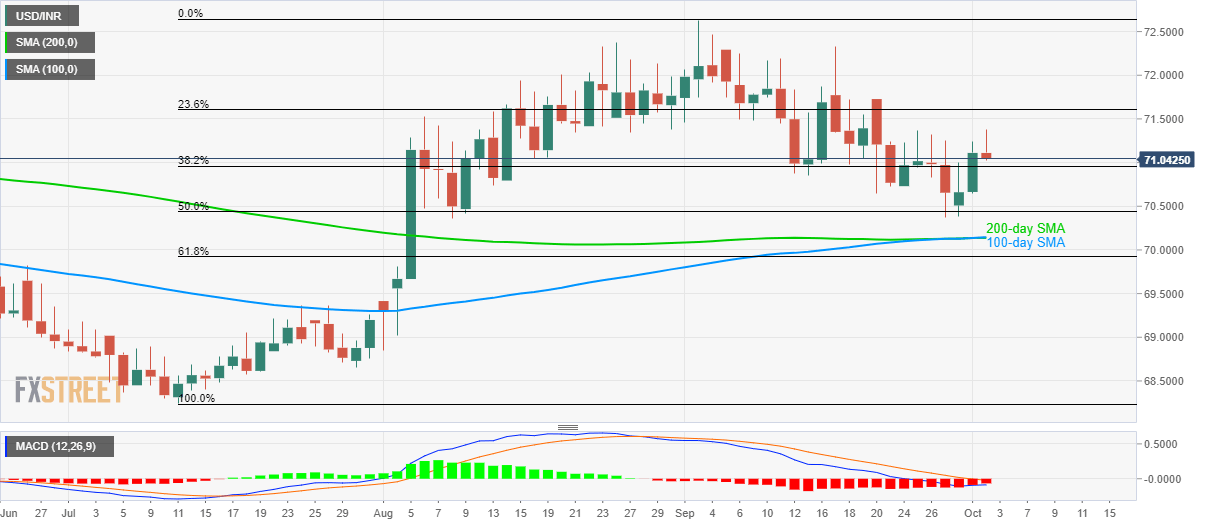
  • 70.36/35 can offer intermediate support before 100/200-day SMA confluence.

Failure to rise past-one week high, coupled with bearish MACD, drags the USD/INR pair down to an intra-day low of 71.03 by the press time of pre-European open on Wednesday.

The pair now aims to revisit 70.36/35 support-zone comprising lows marked in early-August and late-September. However, 70.15/14 confluence including 100 and 200-day simple moving average (SMA) could restrict the pair’s further declines.

Should there be additional weakness below 70.14, late-June and July highs nearing 69.80 and 69.30 will become sellers’ favorites.

If at all buyers ignore the bearish signal from 12-bar moving average convergence and divergence (MACD) and a flash an uptick beyond 71.40 immediate resistance, 71.80 and 72.35 may lure them.

Additionally, pair’s sustained run-up beyond 72.35 could challenge September month high of 72.63 while aiming 73.00 round-figure.

USD/INR daily chart

Trend: pullback expected

additional important levels

Overview
Today last price 71.0425
Today Daily Change -0.0682
Today Daily Change % -0.10%
Today daily open 71.1107
 
Trends
Daily SMA20 71.2885
Daily SMA50 71.0087
Daily SMA100 70.1369
Daily SMA200 70.1355
 
Levels
Previous Daily High 71.242
Previous Daily Low 70.6425
Previous Weekly High 71.37
Previous Weekly Low 70.3685
Previous Monthly High 72.6325
Previous Monthly Low 70.3685
Daily Fibonacci 38.2% 71.013
Daily Fibonacci 61.8% 70.8715
Daily Pivot Point S1 70.7548
Daily Pivot Point S2 70.3989
Daily Pivot Point S3 70.1553
Daily Pivot Point R1 71.3543
Daily Pivot Point R2 71.5979
Daily Pivot Point R3 71.9538


Share: Feed news

Information on these pages contains forward-looking statements that involve risks and uncertainties. Markets and instruments profiled on this page are for informational purposes only and should not in any way come across as a recommendation to buy or sell in these assets. You should do your own thorough research before making any investment decisions. FXStreet does not in any way guarantee that this information is free from mistakes, errors, or material misstatements. It also does not guarantee that this information is of a timely nature. Investing in Open Markets involves a great deal of risk, including the loss of all or a portion of your investment, as well as emotional distress. All risks, losses and costs associated with investing, including total loss of principal, are your responsibility. The views and opinions expressed in this article are those of the authors and do not necessarily reflect the official policy or position of FXStreet nor its advertisers. The author will not be held responsible for information that is found at the end of links posted on this page.

If not otherwise explicitly mentioned in the body of the article, at the time of writing, the author has no position in any stock mentioned in this article and no business relationship with any company mentioned. The author has not received compensation for writing this article, other than from FXStreet.

FXStreet and the author do not provide personalized recommendations. The author makes no representations as to the accuracy, completeness, or suitability of this information. FXStreet and the author will not be liable for any errors, omissions or any losses, injuries or damages arising from this information and its display or use. Errors and omissions excepted.

The author and FXStreet are not registered investment advisors and nothing in this article is intended to be investment advice.

Recommended content


Recommended content

Editors’ Picks

USD/JPY holds above 155.50 ahead of BoJ policy announcement

USD/JPY holds above 155.50 ahead of BoJ policy announcement

USD/JPY is trading tightly above 155.50, off multi-year highs ahead of the BoJ policy announcement. The Yen draws support from higher Japanese bond yields even as the Tokyo CPI inflation cooled more than expected. 

USD/JPY News

AUD/USD extends gains toward 0.6550 after Australian PPI data

AUD/USD extends gains toward 0.6550 after Australian PPI data

AUD/USD is extending gains toward 0.6550 in Asian trading on Friday. The pair capitalizes on an annual increase in Australian PPI data. Meanwhile, a softer US Dollar and improving market mood also underpin the Aussie ahead of the US PCE inflation data. 

AUD/USD News

Gold price keeps its range around $2,330, awaits US PCE data

Gold price keeps its range around $2,330, awaits US PCE data

Gold price is consolidating Thursday's rebound early Friday. Gold price jumped after US GDP figures for the first quarter of 2024 missed estimates, increasing speculation that the Fed could lower borrowing costs. Focus shifts to US PCE inflation on Friday. 

Gold News

Stripe looks to bring back crypto payments as stablecoin market cap hits all-time high

Stripe looks to bring back crypto payments as stablecoin market cap hits all-time high

Stripe announced on Thursday that it would add support for USDC stablecoin, as the stablecoin market exploded in March, according to reports by Cryptocompare.

Read more

US economy: Slower growth with stronger inflation

US economy: Slower growth with stronger inflation

The US Dollar strengthened, and stocks fell after statistical data from the US. The focus was on the preliminary estimate of GDP for the first quarter. Annualised quarterly growth came in at just 1.6%, down from the 2.5% and 3.4% previously forecast.

Read more

Forex MAJORS

Cryptocurrencies

Signatures