|

USD/INR Price Analysis: Indian Rupee bears occupy driver’s seat within falling wedge, 82.75 is the key

  • USD/INR picks up bids to extend the previous day’s rebound inside bullish chart formation.
  • 50-SMA adds strength to 82.75 hurdle for Indian Rupee bears.
  • April’s peak, 200-SMA restrict short-term downside of USD/INR pair.
  • US Dollar grinds higher amid default jitters, full markets’ reaction to US debt ceiling deal.

USD/INR remains on the front foot around 82.67 amid the initial hour of the Indian trading session on Tuesday. With this, the Indian Rupee (INR) pair portrays the market’s favor to the US Dollar amid anxiety ahead of the key US jobs report, as well as due to the mixed concerns about the US debt ceiling agreement and its capacity to become the law.

Amid these plays, the US stock futures print mild gains but the Treasury bond yields remain pressured and challenge the US Dollar Index (DXY) bulls as the greenback’s gauge versus the six major currencies seesaws around a nine-week high.

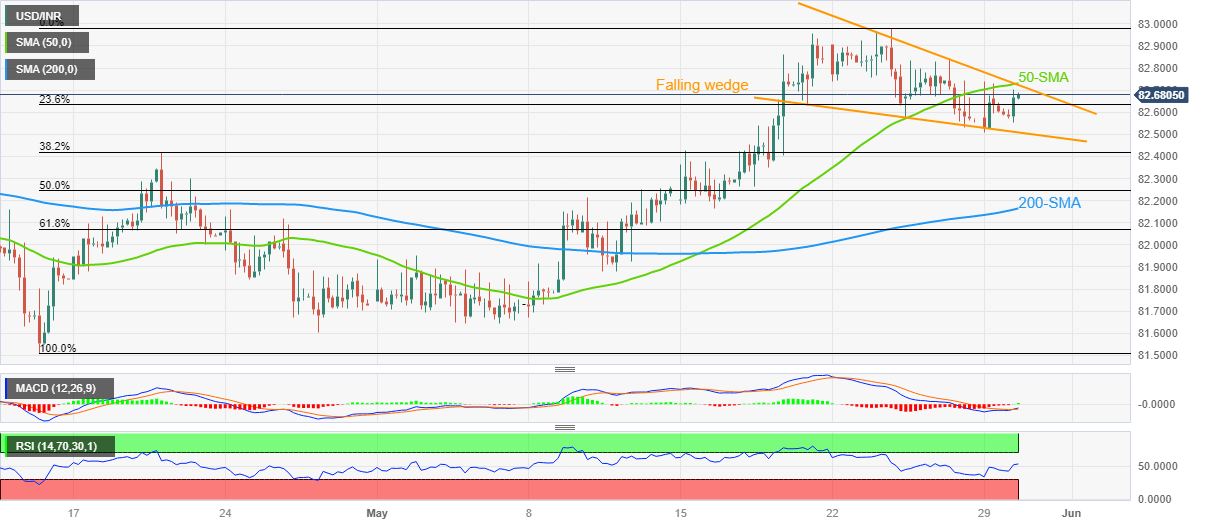
Technically, the USD/INR pair portrays a falling wedge bullish chart formation on the four-hour play, recently approaching the top line of the stated pattern.

It’s worth noting that the recently bullish MACD signals and upbeat RSI (14) line, not overbought, underpin the USD/INR pair’s latest run-up targeting the confirmation of the falling wedge by crossing the 82.75 resistance. Adding strength to the 82.75 hurdle is the 50-bar Simple Moving Average (SMA).

In a case where the USD/INR pair remains strong past 82.75, the monthly peak of around 83.00 may prod the buyers during the theoretical target of the wedge breakout, near 83.25.

Meanwhile, the USD/INR pair’s downside remains limited unless the quote stays beyond the aforementioned wedge’s bottom line, close to 82.50 at the latest.

Even if the USD/INR drops below 82.50, the 200-SMA level of around 82.15 can act as the last defense of the Indian Rupee sellers. It should be observed late April 20 peak of 82.41 also challenges the USD/INR bears.

USD/INR: Four-hour chart

Trend: Further upside expected

Additional important levels

Overview
Today last price82.6727
Today Daily Change0.0877
Today Daily Change %0.11%
Today daily open82.585
 
Trends
Daily SMA2082.3077
Daily SMA5082.1547
Daily SMA10082.1507
Daily SMA20081.8701
 
Levels
Previous Daily High82.738
Previous Daily Low82.5066
Previous Weekly High82.981
Previous Weekly Low82.5302
Previous Monthly High82.5092
Previous Monthly Low81.485
Daily Fibonacci 38.2%82.6496
Daily Fibonacci 61.8%82.5949
Daily Pivot Point S182.4817
Daily Pivot Point S282.3784
Daily Pivot Point S382.2503
Daily Pivot Point R182.7131
Daily Pivot Point R282.8412
Daily Pivot Point R382.9445

Author

Anil Panchal

Anil Panchal

FXStreet

Anil Panchal has nearly 15 years of experience in tracking financial markets. With a keen interest in macroeconomics, Anil aptly tracks global news/updates and stays well-informed about the global financial moves and their implications.

More from Anil Panchal
Share:

Markets move fast. We move first.

Orange Juice Newsletter brings you expert driven insights - not headlines. Every day on your inbox.

By subscribing you agree to our Terms and conditions.

Editor's Picks

EUR/USD trims gains, nears 1.1700

The EUR/USD pair eases in the American afternoon and approaches the 1.1700 mark. The pair surged earlier in the day after the ECB left interest rates unchanged and upwardly revised inflation and growth figures. The US CPI rose 2.7% YoY in November, nearing Fed’s goal.

GBP/USD steadies below 1.3400 as traders digest BoE policy update and US inflation data

The GBP/USD pair stalls the previous day's pullback from the vicinity of mid-1.3400s and a nearly two-month high, though it struggles to attract meaningful buyers during the Asian session on Friday. Spot prices currently trade around the 1.3380-1.3385 region, up only 0.05% for the day, amid mixed cues.

Gold edges lower despite Fed rate cut hopes on cooling US inflation

Gold price declines to below $4,350 during the early Asian trading hours on Friday. The precious metal edges lower due to some profit-taking and weak long liquidation from shorter-term futures traders. 

Top Crypto Losers: Pump.fun, Pudgy Penguins, and Hyperliquid extend bearish streak

Pump.fun, Pudgy Penguins, and Hyperliquid lose ground in an extended bearish streak, recording double-digit losses this week. The surprise drop in the November US Consumer Price Index to 2.7%, beating expectations of 3.1%, fueled a rally in the stock market.

Bank of England cuts rates in heavily divided decision

The Bank of England has cut rates to 3.75%, but the decision was more hawkish than expected, leaving market rates higher and sterling slightly stronger. It's a close call whether the Bank cuts again in February or March.

Ripple holds $1.82 support as low retail demand weighs on the token

Ripple (XRP) is trading between a key support at $1.82 and resistance at $2.00 at the time of writing on Thursday, reflecting the lethargic sentiment in the broader cryptocurrency market.