USD/INR remains tepid ahead of Michigan Consumer Sentiment
- The Indian Rupee may advance as US data reinforce the likelihood of an aggressive Fed rate cut.
- CME FedWatch Tool suggests the likelihood of a 50 bps rate cut has sharply increased to 41.0%.
- India Consumer Price Index increased 3.65% in August, against the expected 3.55% and July’s 3.54% readings.
The USD/INR pair moves slightly lower following the losses registered in the previous as recent US economic data reinforced the odds of an aggressive rate cut by the Federal Reserve (Fed) next week.
According to the CME FedWatch Tool, markets are fully pricing at least a 25 basis point (bps) rate cut by the Federal Reserve at its September meeting. The likelihood of a 50 bps rate cut has sharply increased to 41.0%, up from 14.0% a day ago.
India's August retail inflation was slightly higher than economists' expectations on the back of a sharp rise in vegetable prices, Reuters cited government data released on Thursday. Consumer Price Index (CPI) rose 3.65% in August, compared with expected 3.55% and July’s 3.54% readings.
On Thursday, Reuters cited five traders stating that the Reserve Bank of India (RBI) might have intervened in the open markets to prevent the Indian Rupee (INR) from weakening beyond the 84.00 level. Traders await Trade Deficit Government and FX Reserves, USD scheduled to be released on Friday.
Daily Digest Market Movers: Indian Rupee gains ground due to improved risk sentiment
- The Reserve Bank of India Governor Shaktikanta Das said at the Bretton Woods Committee's annual Future of Finance Forum on Friday that India's growth potential is 7.5% or more, which is a little above the central bank's full-year forecast for 2024 of 7.2%, per Reuters.
- The US Producer Price Index (PPI) rose to 0.2% month-on-month in August, exceeding the forecasted 0.1% increase and the previous 0.0%. Meanwhile, core PPI accelerated to 0.3% MoM, against the expected 0.2% rise and July’s 0.2% contraction.
- US Initial Jobless Claims rose slightly higher for the week ended September 6, increasing to the expected 230K from the prior 228K reading.
- India’s Industrial Output rose by 4.8% in July, slightly above market expectations of 4.7%, following a 4.2% growth in the previous month.
- India is considering relaxing investment rules for Chinese firms to stimulate its manufacturing sector. Additionally, the country has eased visa issuance for Chinese nationals to support local manufacturing. India's trade deficit with China has nearly doubled since 2020, according to a Reuters report.
- The US Consumer Price Index dipped to 2.5% year-on-year in August, from the previous reading of 2.9%. The index has fallen short of the expected 2.6% reading. Meanwhile, headline CPI stood at 0.2% MoM. Core CPI ex Food & Energy, remained unchanged at 3.2% YoY. On a monthly basis, core CPI rose to 0.3% from the previous 0.2% reading.
- The first US presidential debate between former President Donald Trump and Democratic nominee Kamala Harris in Pennsylvania was won by Harris, according to a CNN poll. The debate began with a critical focus on the economy, inflation, and economic policies.
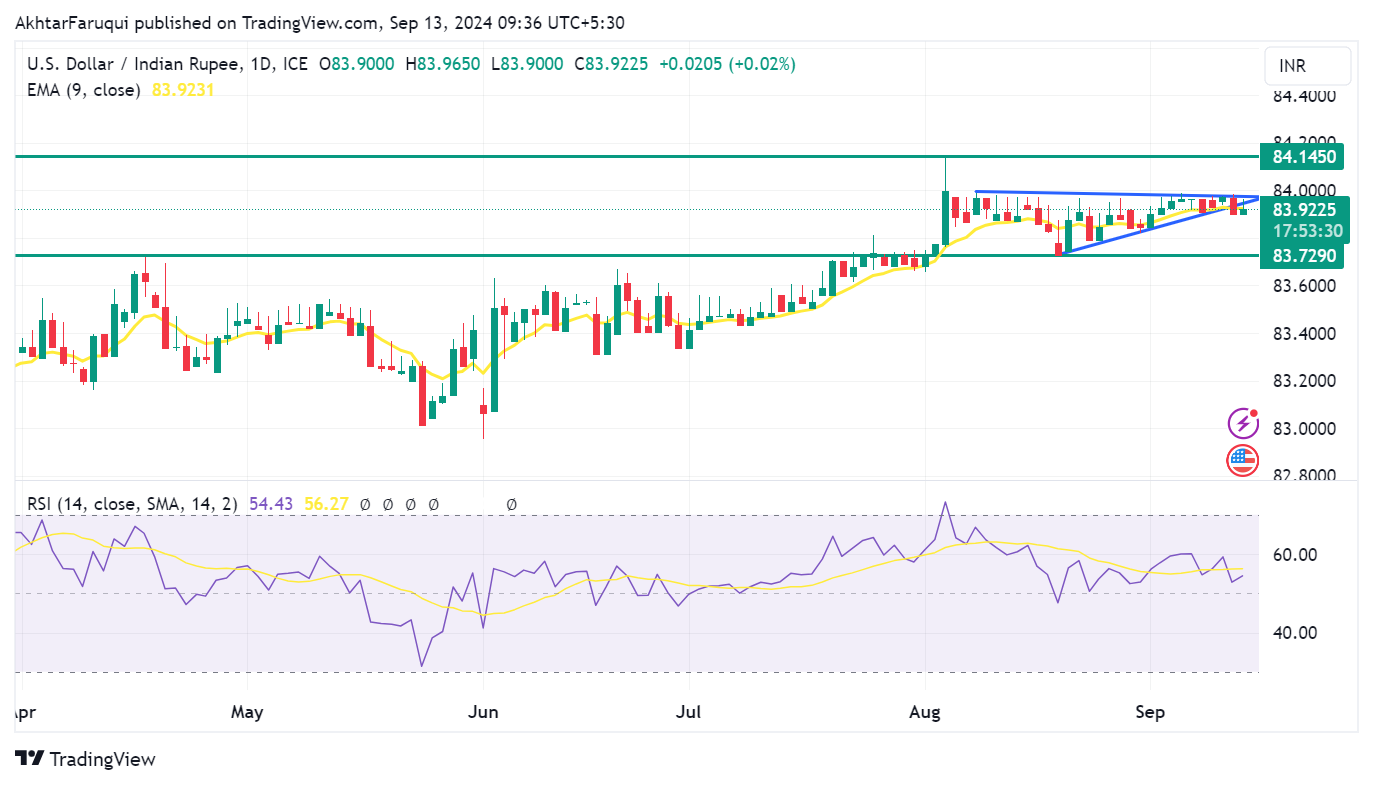
Technical Analysis: USD/INR breaks below symmetrical triangle, hovering below 84.00
The USD/INR pair trades around 83.90 on Friday. Analysis of the daily chart shows that the USD/INR pair has broken below the symmetrical triangle pattern, indicating the emergence of a bearish bias. However, the 14-day Relative Strength Index (RSI) remains slightly above the 50 level, suggesting a retest of the triangle pullback cannot be ruled out.
On the downside, the USD/INR pair may retest its six-week low around 83.72, followed by the psychological level of 83.50.
In terms of resistance, the nine-day Exponential Moving Average (EMA) at 83.91 could serve as an immediate barrier, aligning with the lower boundary of the symmetrical triangle near 83.95.
Further resistance appears at the upper boundary of the symmetrical triangle near the 84.00 level. A breakout above this point could propel the pair toward the all-time high of 84.14, recorded on August 5.
USD/INR: Daily Chart
Economic Indicator
Michigan Consumer Sentiment Index
The Michigan Consumer Sentiment Index, released on a monthly basis by the University of Michigan, is a survey gauging sentiment among consumers in the United States. The questions cover three broad areas: personal finances, business conditions and buying conditions. The data shows a picture of whether or not consumers are willing to spend money, a key factor as consumer spending is a major driver of the US economy. The University of Michigan survey has proven to be an accurate indicator of the future course of the US economy. The survey publishes a preliminary, mid-month reading and a final print at the end of the month. Generally, a high reading is bullish for the US Dollar (USD), while a low reading is bearish.
Read more.Next release: Fri Sep 13, 2024 14:00 (Prel)
Frequency: Monthly
Consensus: 68
Previous: 67.9
Source: University of Michigan
Consumer exuberance can translate into greater spending and faster economic growth, implying a stronger labor market and a potential pick-up in inflation, helping turn the Fed hawkish. This survey’s popularity among analysts (mentioned more frequently than CB Consumer Confidence) is justified because the data here includes interviews conducted up to a day or two before the official release, making it a timely measure of consumer mood, but foremost because it gauges consumer attitudes on financial and income situations. Actual figures beating consensus tend to be USD bullish.
Author

Akhtar Faruqui
FXStreet
Akhtar Faruqui is a Forex Analyst based in New Delhi, India. With a keen eye for market trends and a passion for dissecting complex financial dynamics, he is dedicated to delivering accurate and insightful Forex news and analysis.


