USD/CNY technical analysis: 21-DMA regains buyer’s attention amid latest recovery
- 61.8% Fibonacci retracement, 200-day SMA, limits the USD/CNY pair’s immediate downside.
- Buyers aim for 21-day SMA on the back of the latest recovery.
- Upward sloping RSI add strength into the ascending momentum.

While 200-day simple moving average (SMA) triggered the USD/CNY pair’s U-turn, buyers now aim for 21-day SMA level as the quote clocks around 6.8813 during early Tuesday.
Ahead of the 6.9044 SMA figure, early-month lows around 6.8980/90 can entertain buyers.
If prices remain strong beyond 6.9044, an eight-month-old descending trend-line at 6.9294 and December 2018 top close to 6.9605 could be on the bull’s radar.
Meanwhile, 618% Fibonacci retracement of October 2018 to March 2019 decline, at 6.8605, offers immediate support to the pair before highlighting 200-day SMA level of 6.8311 as the rest-point.
In a case where the quote slips beneath the longer-term MA, 100-day SMA level of 6.7835 is likely to please sellers.
It should also be noted that 14-day relative strength index (RSI) is on the upward trajectory from the near oversold region, which in turn flashes brighter chances of the pair’s up-moves.
USD/CNY daily chart
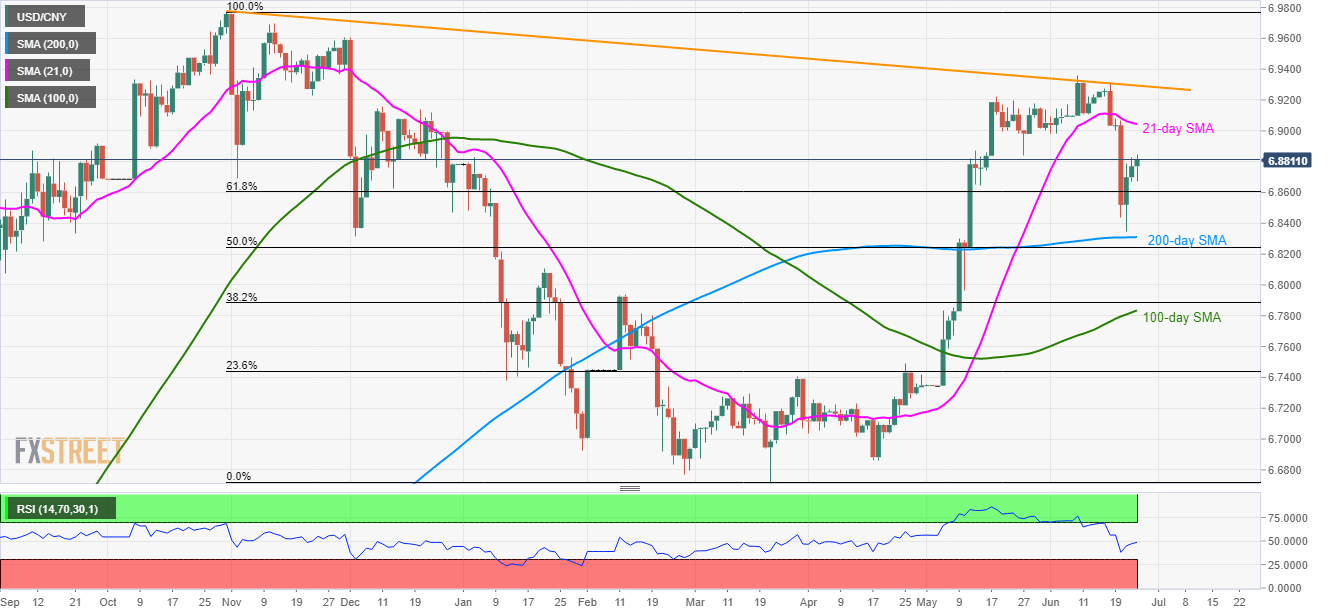
Trend: Bullish
Author

Anil Panchal
FXStreet
Anil Panchal has nearly 15 years of experience in tracking financial markets. With a keen interest in macroeconomics, Anil aptly tracks global news/updates and stays well-informed about the global financial moves and their implications.


