USD/CNH Price Analysis: Prints mild losses below 6.9800 resistance confluence


  • USD/CNH eases from a one-week high to pare the previous day’s gain.
  • 100-DMA, support-turned-resistance from early February appears a tough nut to crack for bulls.
  • Looming bear cross on MACD, steady RSI (14) hints at further grinding towards the previous resistance line.

USD/CNH takes offers to extend the initial pullback from a one-week high, down 0.15% intraday near 6.9400 during Tuesday’s Asian session. In doing so, the offshore Chinese Yuan (CNH) pair consolidates the previous day’s gains amid downbeat oscillators and a failure to cross the key upside hurdle.

That said, the MACD signals lose their bullish bias and the bear cross seems to loom. On the same line, the RSI (14) also remains mostly steady and backs the latest weakness of the pair.

It’s worth noting that the failure to cross the 38.2% Fibonacci retracement level of the pair’s October 2022 to January 2023 fall, near 6.9560, triggered the quote’s latest pullback.

Apart from the immediate Fibonacci retracement hurdle, a convergence of the 100-DMA and an upward-sloping trend line from early February, the previous support line, close to 6.9800, appears a tough nut to crack for the USD/CNH bulls.

Meanwhile, pullback moves appear on the way to test the resistance-turned-support line from October 2022, close to 6.8550.

Following that, the late January swing high near 6.7950 could entertain the USD/CNH bears before directing them to the yearly low of 6.6975.

USD/CNH: Daily chart

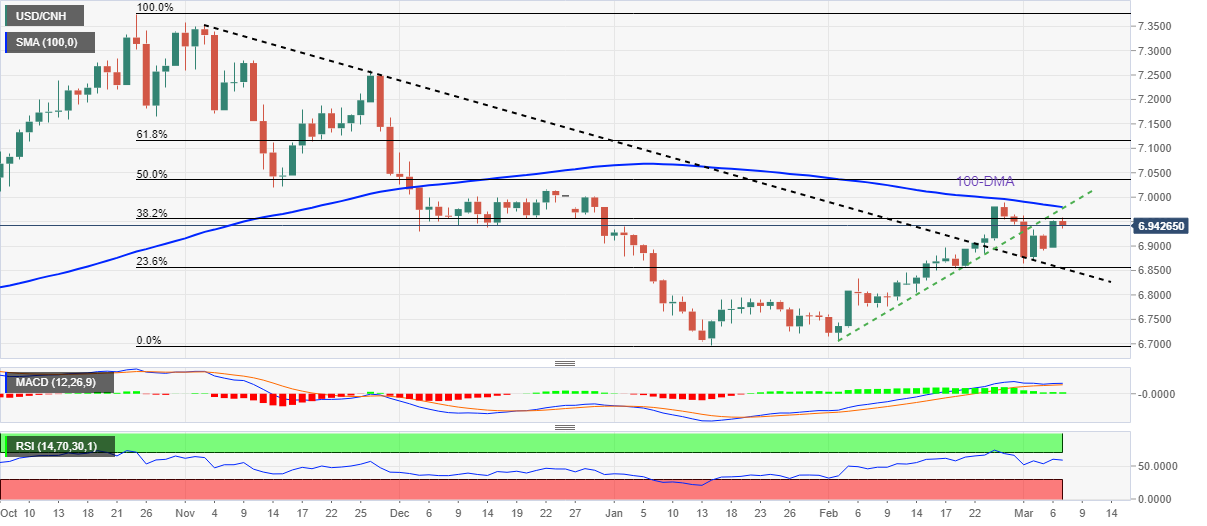
Trend: Further downside expected

Additional important levels

Overview
Today last price 6.9398
Today Daily Change -0.0114
Today Daily Change % -0.16%
Today daily open 6.9512
 
Trends
Daily SMA20 6.8791
Daily SMA50 6.8389
Daily SMA100 6.9825
Daily SMA200 6.9177
 
Levels
Previous Daily High 6.9522
Previous Daily Low 6.8966
Previous Weekly High 6.9898
Previous Weekly Low 6.8634
Previous Monthly High 6.9898
Previous Monthly Low 6.7056
Daily Fibonacci 38.2% 6.931
Daily Fibonacci 61.8% 6.9179
Daily Pivot Point S1 6.9144
Daily Pivot Point S2 6.8778
Daily Pivot Point S3 6.8588
Daily Pivot Point R1 6.97
Daily Pivot Point R2 6.989
Daily Pivot Point R3 7.0256


Share: Feed news

Information on these pages contains forward-looking statements that involve risks and uncertainties. Markets and instruments profiled on this page are for informational purposes only and should not in any way come across as a recommendation to buy or sell in these assets. You should do your own thorough research before making any investment decisions. FXStreet does not in any way guarantee that this information is free from mistakes, errors, or material misstatements. It also does not guarantee that this information is of a timely nature. Investing in Open Markets involves a great deal of risk, including the loss of all or a portion of your investment, as well as emotional distress. All risks, losses and costs associated with investing, including total loss of principal, are your responsibility. The views and opinions expressed in this article are those of the authors and do not necessarily reflect the official policy or position of FXStreet nor its advertisers. The author will not be held responsible for information that is found at the end of links posted on this page.

If not otherwise explicitly mentioned in the body of the article, at the time of writing, the author has no position in any stock mentioned in this article and no business relationship with any company mentioned. The author has not received compensation for writing this article, other than from FXStreet.

FXStreet and the author do not provide personalized recommendations. The author makes no representations as to the accuracy, completeness, or suitability of this information. FXStreet and the author will not be liable for any errors, omissions or any losses, injuries or damages arising from this information and its display or use. Errors and omissions excepted.

The author and FXStreet are not registered investment advisors and nothing in this article is intended to be investment advice.

Recommended content


Recommended content

Editors’ Picks

EUR/USD fluctuates in daily range above 1.0600

EUR/USD fluctuates in daily range above 1.0600

EUR/USD struggles to gather directional momentum and continues to fluctuate above 1.0600 on Tuesday. The modest improvement seen in risk mood limits the US Dollar's gains as investors await Fed Chairman Jerome Powell's speech.

EUR/USD News

GBP/USD stabilizes near 1.2450 ahead of Powell speech

GBP/USD stabilizes near 1.2450 ahead of Powell speech

GBP/USD holds steady at around 1.2450 after recovering from the multi-month low it touched near 1.2400 in the European morning. The USD struggles to gather strength after disappointing housing data. Market focus shifts to Fed Chairman Powell's appearance.

GBP/USD News

Gold aiming to re-conquer the $2,400 level

Gold aiming to re-conquer the $2,400 level

Gold stages a correction on Tuesday and fluctuates in negative territory near $2,370 following Monday's upsurge. The benchmark 10-year US Treasury bond yield continues to push higher above 4.6% and makes it difficult for XAU/USD to gain traction.

Gold News

XRP struggles below $0.50 resistance as SEC vs. Ripple lawsuit likely to enter final pretrial conference

XRP struggles below $0.50 resistance as SEC vs. Ripple lawsuit likely to enter final pretrial conference

XRP is struggling with resistance at $0.50 as Ripple and the US Securities and Exchange Commission (SEC) are gearing up for the final pretrial conference on Tuesday at a New York court. 

Read more

US outperformance continues

US outperformance continues

The economic divergence between the US and the rest of the world has become increasingly pronounced. The latest US inflation prints highlight that underlying inflation pressures seemingly remain stickier than in most other parts of the world.

Read more

Forex MAJORS

Cryptocurrencies

Signatures