USD/CHF technical analysis: Bull in control above 21-day EMA, short-term rising support-line
- USD/CHF remains modestly changed above 13-day-old rising trend-line, 21-day EMA.
- An ascending trend-line from August 13 adds to the support.
- August month top, 61.8% Fibonacci retracement level challenge buyers.

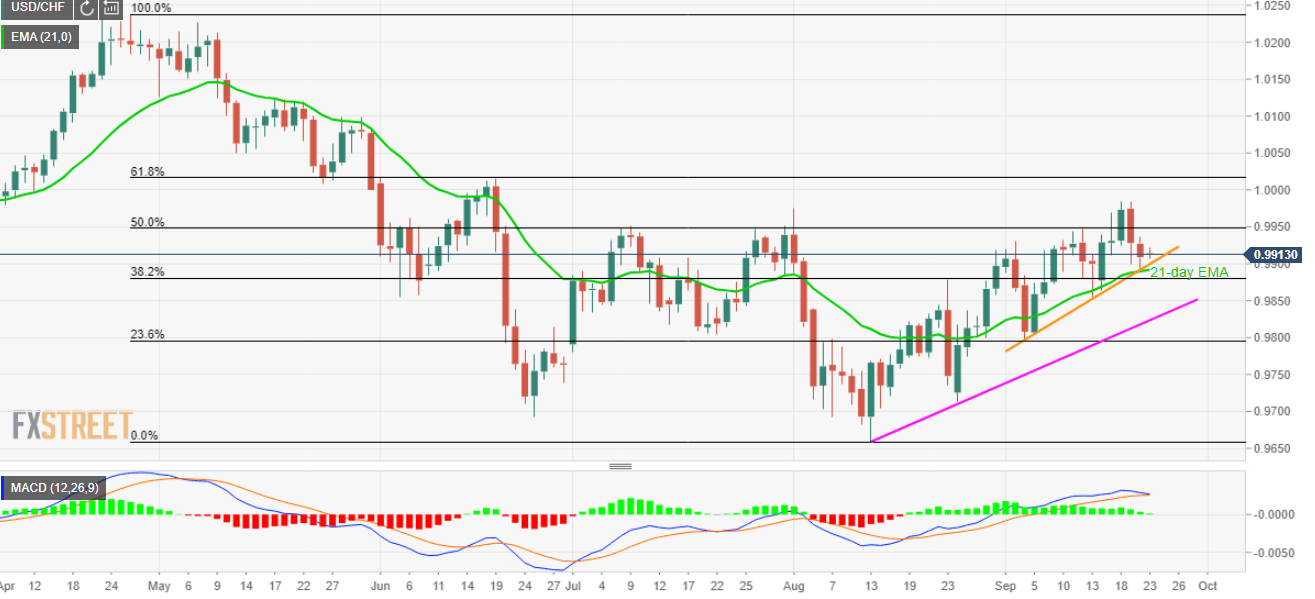
The USD/CHF pair’s failure to provide a decisive break above August high seems to not disappoint buyers, even for short-term, unless the quote trades below key support-confluence. Prices seesaw around 0.9910 while heading into the European open on Monday.
The 0.9892/0.9900 area including 21-day exponential moving average (EMA) and a rising trend-line since September 04 acts as near-term key support to watch as the break of which could drag prices to 38.2% Fibonacci retracement of April-August declines, at 0.9880.
Pair’s south-run below 0.9880 can avail 0.9840 and nearly six-week-long ascending support-line around 0.9820 as rest-points.
On the upside, the recent high of 0.9985 and 61.8% Fibonacci retracement level of 1.0017 keep challenging buyers.
USD/CHF daily chart
Trend: bullish
Author

Anil Panchal
FXStreet
Anil Panchal has nearly 15 years of experience in tracking financial markets. With a keen interest in macroeconomics, Anil aptly tracks global news/updates and stays well-informed about the global financial moves and their implications.


