|

USD/CHF technical analysis: 200-DMA, 50% Fibo. restrict immediate upside

  • USD/CHF follows a four-week-old rising trend-channel.
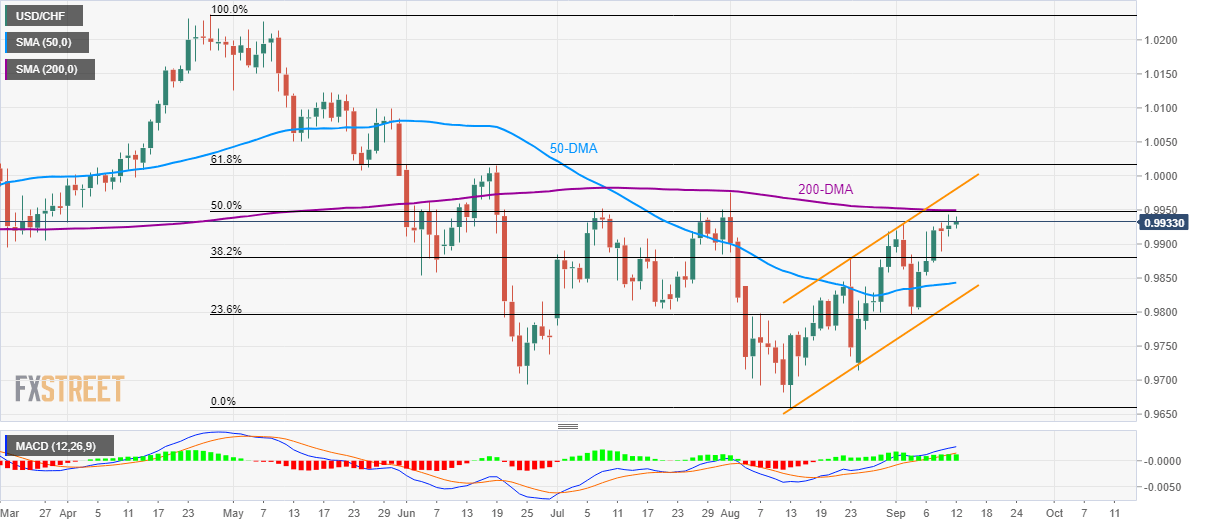
  • 0.9950 resistance confluence holds the key for a run-up to channel’s upper-line.

USD/CHF again attempts to conquer 200-day simple moving average (DMA) as it takes the bids to 0.9940 ahead of Thursday’s European session open.

Increasing the strength of the resistance is 50% Fibonacci retracement of April-August declines, at 0.9950, a break of which will escalate the pair’s rise towards channel’s resistance-line, at 0.9980 now.

In a case bulls refrain from respecting 0.9980, the 1.000 psychological magnet and 61.8% Fibonacci retracement level of 1.00165 will be on their radars.

On the contrary, 38.2% Fibonacci retracement level of 0.9880 could restrict the pair’s near-term declines, a break of which could highlight 50-DMA level of 0.9845 and channel’s lower-line, at 0.9820.

If at all 0.9820 falls short of pulling the pair up, 23.6% Fibonacci retracement level near 0.9800 and late-August bottom surrounding 0.9715 could lure bears.

USD/CHF daily chart

Trend: pullback expected

additional important levels

Overview
Today last price0.9936
Today Daily Change9 pips
Today Daily Change %0.09%
Today daily open0.9927
 
Trends
Daily SMA200.9841
Daily SMA500.9842
Daily SMA1000.9925
Daily SMA2000.995
Levels
Previous Daily High0.9944
Previous Daily Low0.9911
Previous Weekly High0.993
Previous Weekly Low0.9797
Previous Monthly High0.9976
Previous Monthly Low0.9659
Daily Fibonacci 38.2%0.9931
Daily Fibonacci 61.8%0.9924
Daily Pivot Point S10.9911
Daily Pivot Point S20.9894
Daily Pivot Point S30.9878
Daily Pivot Point R10.9944
Daily Pivot Point R20.996
Daily Pivot Point R30.9977

Author

Anil Panchal

Anil Panchal

FXStreet

Anil Panchal has nearly 15 years of experience in tracking financial markets. With a keen interest in macroeconomics, Anil aptly tracks global news/updates and stays well-informed about the global financial moves and their implications.

More from Anil Panchal
Share:

Editor's Picks

EUR/USD weakens as US jobs data trims Fed rate cut bets

The EUR/USD pair trades in negative territory for the third consecutive day near 1.1860 during the early European session on Thursday. Traders will keep an eye on the US weekly Initial Jobless Claims data. On Friday, the attention will shift to the US Consumer Price Index inflation report. 

GBP/USD bullish outlook prevails above 1.3600, UK GDP data looms

The GBP/USD pair gains ground near 1.3635, snapping the two-day losing streak during the early European session on Thursday. The preliminary reading of UK Gross Domestic Product for the fourth quarter will be closely watched later on Thursday. The UK economy is estimated to grow 0.2% QoQ in Q4, versus 0.1% in Q1. 

Gold remains on the defensive below two-week top; lacks bearish conviction amid mixed cues

Gold sticks to modest intraday losses through the Asian session on Thursday, though it lacks follow-through selling and remains close to a nearly two-week high, touched the previous day. The commodity currently trades above the $5,070 level, down just over 0.20% for the day, amid mixed cues.

UK GDP set to post weak growth as markets rise bets on March rate cut

Markets will be watching closely on Thursday, when the United Kingdom’s Office for National Statistics will release the advance estimate of Q4 Gross Domestic Product. If the data land in line with consensus, the UK economy would have continued to grow at an annualised pace of 1.2%, compared with 1.3% recorded the previous year. 

The market trades the path not the past

The payroll number did not just beat. It reset the tone. 130,000 vs. 65,000 expected, with a 35,000 whisper. 79 of 80 economists leaning the wrong way. Unemployment and underemployment are edging lower. For all the statistical fog around birth-death adjustments and seasonal quirks, the core message was unmistakable. The labour market is not cracking.

Sonic Labs’ vertical integration fuels recovery in S token

Sonic, previously Fantom (FTM), is extending its recovery trade at $0.048 at the time of writing, after rebounding by over 12% the previous day. The recovery thesis’ strengths lie in the optimism surrounding Sonic Labs’ Wednesday announcement to shift to a vertically integrated model, aimed at boosting S token utility.