• USD/CHF bull’s clashed with the 20-day EMA, then jumped from the boat as bears stepped in.
  • The pair is headed toward the psychological 0.9100, which, once broken, could put the YTD low into play.
  • USD/CHF: Failure to register a new YTD low could exacerbate an upward correction.


The USD/CHF battles to break above the 20-day Exponential Moving Average (EMA) and slips beneath 0.9200 to fresh two-day lows at 0.9172 as the US Dollar remains offered in the FX space. Also, a risk-off impulse underpins the safe-haven status of the Swiss franc (CHF). Hence, the USD/CHF exchanges hand at 0.9182 after hitting a daily high of 0.9245.

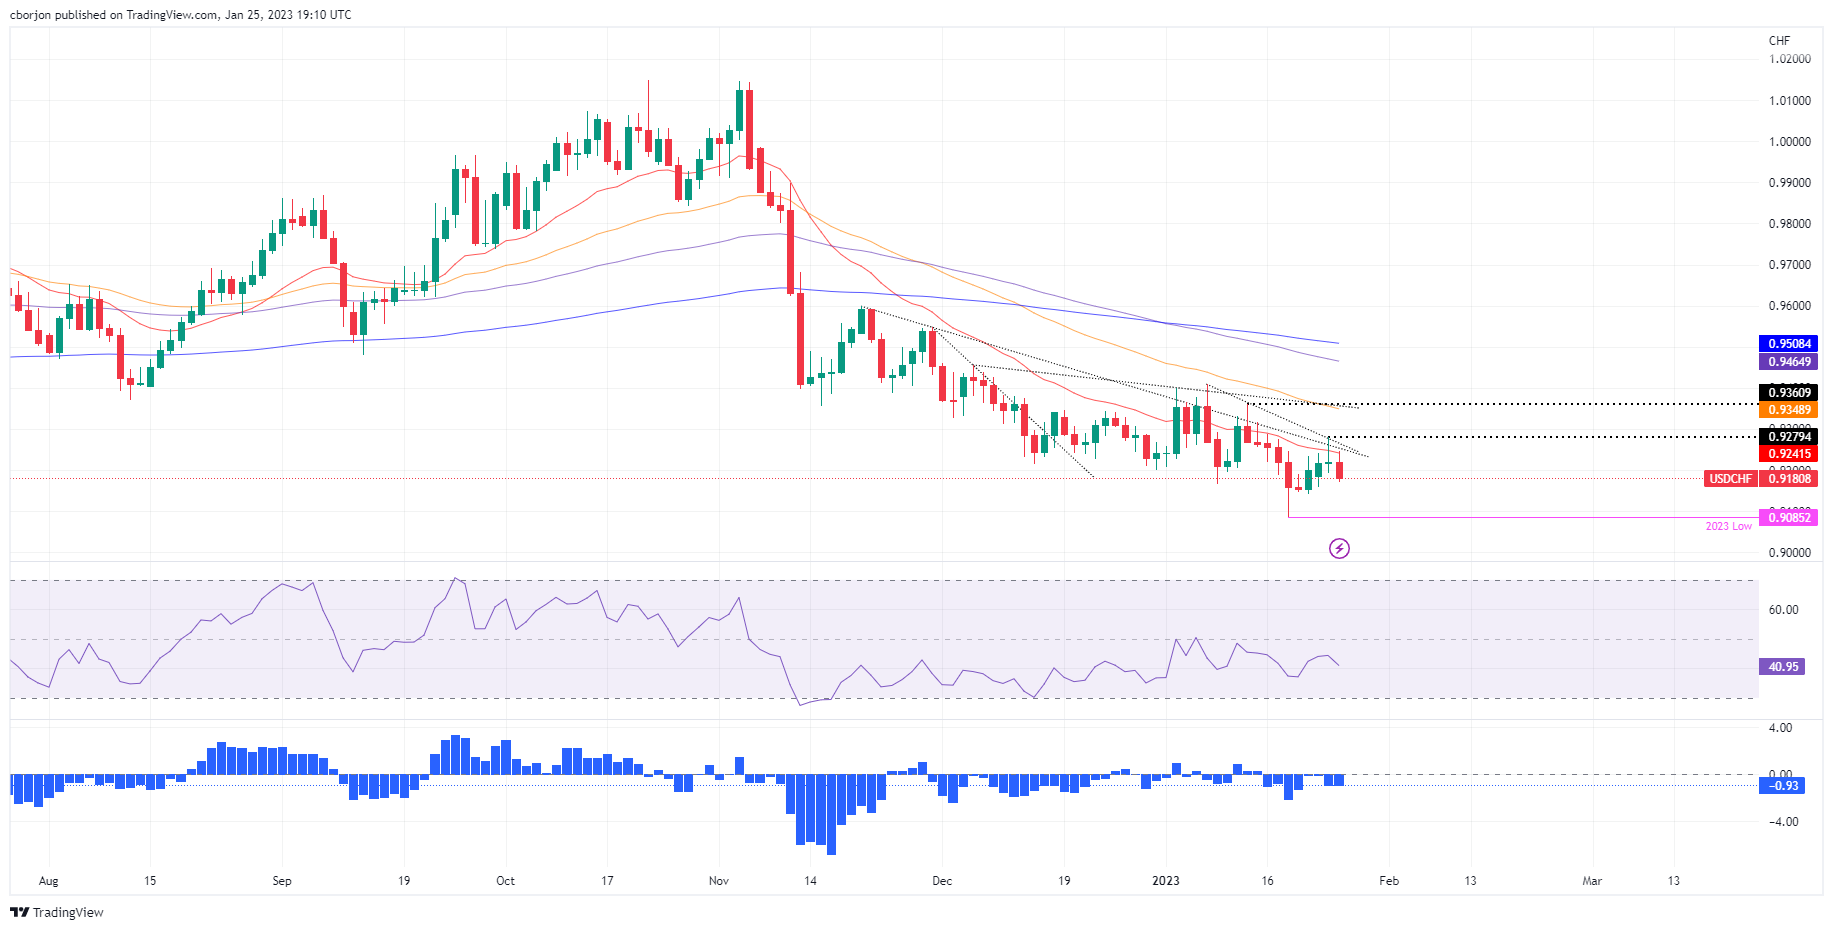
USD/CHF Price Analysis: Technical outlook

The USD/CHF continued its downtrend after hitting a weekly high of 0.9297, unable to reclaim 0.9300, which exacerbated the fall below the 20-day EMA at 0.9241. Also, the path for the USD/CHF pair was opened to test the year-to-date (YTD) lows of 0.9085, though initially, it would need to hurdle demand zones in between.

On its way to the YTD lows, the USD/CHF’s first support level would be this week’s low of 0.9159. Break below will expose the January 20 daily low of 0.9141, ahead of the 0.9100 mark. Once that psychological price level gives way, then the YTD low would be in play.

As an alternate scenario, the USD/CHF first resistance would be the 0.9200 figure. Once cleared, then, the USD/CHF could test the 20-day EMA at 0.9241, followed by a two-month-old downslope trendline around 0.9250/60.

Looking ahead, USD/CHF’s failure to test the YTD low could expose the USD/CHF to some buying pressure, as the pair has been bottoming around 0.9085/0.9160 since December 2022.

USD/CHF Key Technical Levels

USD/CHF

Overview
Today last price 0.9182
Today Daily Change -0.0046
Today Daily Change % -0.50
Today daily open 0.9228
 
Trends
Daily SMA20 0.9253
Daily SMA50 0.9336
Daily SMA100 0.9584
Daily SMA200 0.9637
 
Levels
Previous Daily High 0.928
Previous Daily Low 0.9192
Previous Weekly High 0.9288
Previous Weekly Low 0.9085
Previous Monthly High 0.9471
Previous Monthly Low 0.9201
Daily Fibonacci 38.2% 0.9246
Daily Fibonacci 61.8% 0.9226
Daily Pivot Point S1 0.9187
Daily Pivot Point S2 0.9146
Daily Pivot Point S3 0.91
Daily Pivot Point R1 0.9274
Daily Pivot Point R2 0.9321
Daily Pivot Point R3 0.9362


Share: Feed news

Information on these pages contains forward-looking statements that involve risks and uncertainties. Markets and instruments profiled on this page are for informational purposes only and should not in any way come across as a recommendation to buy or sell in these assets. You should do your own thorough research before making any investment decisions. FXStreet does not in any way guarantee that this information is free from mistakes, errors, or material misstatements. It also does not guarantee that this information is of a timely nature. Investing in Open Markets involves a great deal of risk, including the loss of all or a portion of your investment, as well as emotional distress. All risks, losses and costs associated with investing, including total loss of principal, are your responsibility. The views and opinions expressed in this article are those of the authors and do not necessarily reflect the official policy or position of FXStreet nor its advertisers. The author will not be held responsible for information that is found at the end of links posted on this page.

If not otherwise explicitly mentioned in the body of the article, at the time of writing, the author has no position in any stock mentioned in this article and no business relationship with any company mentioned. The author has not received compensation for writing this article, other than from FXStreet.

FXStreet and the author do not provide personalized recommendations. The author makes no representations as to the accuracy, completeness, or suitability of this information. FXStreet and the author will not be liable for any errors, omissions or any losses, injuries or damages arising from this information and its display or use. Errors and omissions excepted.

The author and FXStreet are not registered investment advisors and nothing in this article is intended to be investment advice.

Recommended content


Recommended content

Editors’ Picks

EUR/USD stays in positive territory above 1.0850 after US data

EUR/USD stays in positive territory above 1.0850 after US data

EUR/USD clings to modest daily gains above 1.0850 in the second half of the day on Friday. The improving risk mood makes it difficult for the US Dollar to hold its ground after PCE inflation data, helping the pair edge higher ahead of the weekend.

EUR/USD News

GBP/USD stabilizes above 1.2850 as risk mood improves

GBP/USD stabilizes above 1.2850 as risk mood improves

GBP/USD maintains recovery momentum and fluctuates above 1.2850 in the American session on Friday. The positive shift seen in risk mood doesn't allow the US Dollar to preserve its strength and supports the pair.

GBP/USD News

Gold rebounds above $2,380 as US yields stretch lower

Gold rebounds above $2,380 as US yields stretch lower

Following a quiet European session, Gold gathers bullish momentum and trades decisively higher on the day above $2,380. The benchmark 10-year US Treasury bond yield loses more than 1% on the day after US PCE inflation data, fuelling XAU/USD's upside.

Gold News

Avalanche price sets for a rally following retest of key support level

Avalanche price sets for a rally following retest of  key support level

Avalanche (AVAX) price bounced off the $26.34 support level to trade at $27.95 as of Friday. Growing on-chain development activity indicates a potential bullish move in the coming days.

Read more

The election, Trump's Dollar policy, and the future of the Yen

The election, Trump's Dollar policy, and the future of the Yen

After an assassination attempt on former President Donald Trump and drop out of President Biden, Kamala Harris has been endorsed as the Democratic candidate to compete against Trump in the upcoming November US presidential election.

Read more

Forex MAJORS

Cryptocurrencies

Signatures