USD/CHF Price Analysis: Retreats from monthly high below 0.9100 within rising wedge


Share:
  • USD/CHF renews intraday low while reversing from six-week high.
  • U-turn from resistance line of rising wedge bearish pattern tease sellers despite upbeat oscillators.
  • 50-DMA adds strength to 0.9000 support confluence, a break of which could welcome Swiss Franc buyers.

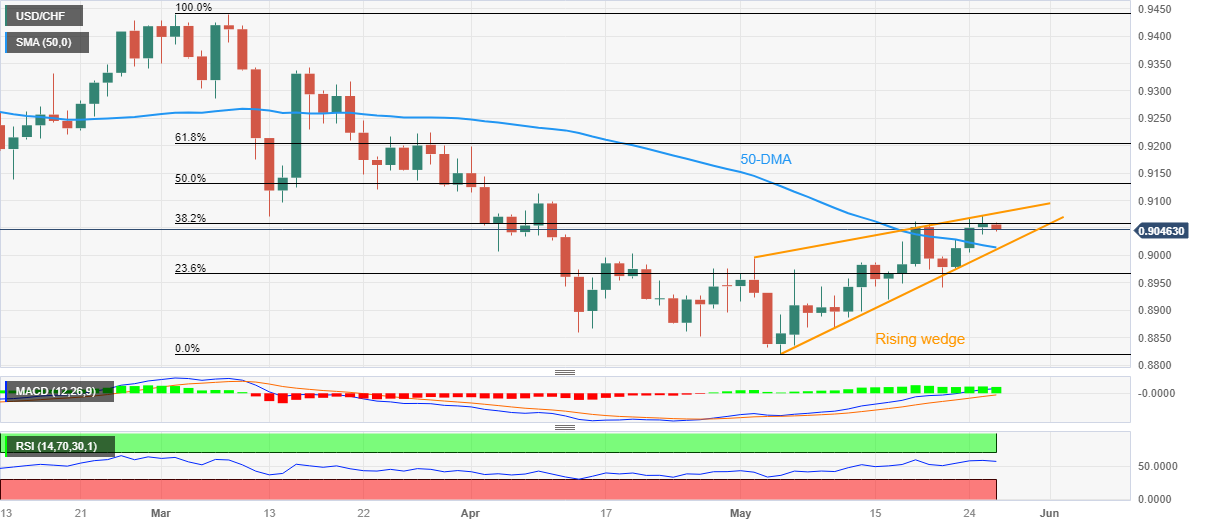
USD/CHF takes offers to refresh the intraday low near 0.9040 as it prints the first daily loss in four during early Friday. In doing so, the Swiss Franc pair retreats from the resistance line of a three-week-old rising wedge bearish chart formation.

It’s worth noting, however, that the MACD indicator flashes bullish signals and the RSI (14) line is also above the 50.0 level, which in turn suggests the USD/CHF pair’s bullish momentum strength and keeps the bear’s off the table.

Also challenging the USD/CHF sellers is the 0.9000 support confluence comprising the 50-DMA and bottom line of the aforementioned wedge.

In a case where the USD/CHF price manages to provide a daily close below the 0.9000 mark, it becomes theoretically vulnerable to renewing the yearly low by dropping to the 0.8750 mark.

That said, the multiple levels around 0.8860-50 and the monthly low of bear 0.8820 may prod the sellers.

Meanwhile, the current place of the stated rising wedge’s top line, near 0.9075, precedes the 0.9100 round figure and April 10 peak of around 0.9115 to challenge the USD/CHF buyers.

Following that, a run-up towards the 61.8% Fibonacci retracement level of March-May downside near 0.9205 can’t be ruled out.

USD/CHF: Daily chart

Trend: Pullback expected

Additional important levels

Overview
Today last price 0.9047
Today Daily Change -0.0010
Today Daily Change % -0.11%
Today daily open 0.9057
 
Trends
Daily SMA20 0.8956
Daily SMA50 0.9019
Daily SMA100 0.9139
Daily SMA200 0.9393
 
Levels
Previous Daily High 0.9073
Previous Daily Low 0.9038
Previous Weekly High 0.9063
Previous Weekly Low 0.892
Previous Monthly High 0.9198
Previous Monthly Low 0.8852
Daily Fibonacci 38.2% 0.906
Daily Fibonacci 61.8% 0.9051
Daily Pivot Point S1 0.9039
Daily Pivot Point S2 0.902
Daily Pivot Point S3 0.9003
Daily Pivot Point R1 0.9074
Daily Pivot Point R2 0.9092
Daily Pivot Point R3 0.911


Share: Feed news

Information on these pages contains forward-looking statements that involve risks and uncertainties. Markets and instruments profiled on this page are for informational purposes only and should not in any way come across as a recommendation to buy or sell in these assets. You should do your own thorough research before making any investment decisions. FXStreet does not in any way guarantee that this information is free from mistakes, errors, or material misstatements. It also does not guarantee that this information is of a timely nature. Investing in Open Markets involves a great deal of risk, including the loss of all or a portion of your investment, as well as emotional distress. All risks, losses and costs associated with investing, including total loss of principal, are your responsibility. The views and opinions expressed in this article are those of the authors and do not necessarily reflect the official policy or position of FXStreet nor its advertisers. The author will not be held responsible for information that is found at the end of links posted on this page.

If not otherwise explicitly mentioned in the body of the article, at the time of writing, the author has no position in any stock mentioned in this article and no business relationship with any company mentioned. The author has not received compensation for writing this article, other than from FXStreet.

FXStreet and the author do not provide personalized recommendations. The author makes no representations as to the accuracy, completeness, or suitability of this information. FXStreet and the author will not be liable for any errors, omissions or any losses, injuries or damages arising from this information and its display or use. Errors and omissions excepted.

The author and FXStreet are not registered investment advisors and nothing in this article is intended to be investment advice.

Follow us on Telegram

Stay updated of all the news

Join Telegram

Recommended content


Follow us on Telegram

Stay updated of all the news

Join Telegram

Recommended content

Editors’ Picks

EUR/USD drops to multi-month lows below 1.0600 as USD rallies

EUR/USD drops to multi-month lows below 1.0600 as USD rallies

EUR/USD came under renewed bearish pressure and dropped to its lowest level since March below 1.0600 on Monday. While ECB President Lagarde's cautious comments on the policy outlook forces the Euro to stay on the back foot, the USD benefits from risk aversion and further weighs on the pair.

EUR/USD News

GBP/USD tests 1.2200 as mood sours

GBP/USD tests 1.2200 as mood sours

Following a short-lasting recovery attempt in the European session, GBP/USD turned south and touched its weakest level in six months near 1.2200. Following a bearish opening in Wall Street, the US Dollar continues to gather strength and causes the pair to stretch lower.

GBP/USD News

Gold drops below $1,920 as US yields rally

Gold drops below $1,920 as US yields rally

After climbing toward $1,930 in the European session on Monday, Gold price reversed its direction and turned negative on the day below $1,920. The benchmark 10-year US Treasury bond yield is up more than 2% on Monday above 4.5%, weighing heavily on XAU/USD.

Gold News

Top 5 cryptocurrencies in the buy zone ARB, ADA, PEPE, SHIB, COMP: Santiment analysts

Top 5 cryptocurrencies in the buy zone ARB, ADA, PEPE, SHIB, COMP: Santiment analysts

Bitcoin price tumbled to $26,110, early on Monday, traders are likely to shift their attention to altcoins, looking for price gains. On-chain intelligence tracker Santiment, developed an “Asset Activity Matrix,” a tool that compares over 180 altcoins, to identify assets with high and low activity.

Read more

S&P 500 Forecast: Worries abound after index has worst week since March

S&P 500 Forecast: Worries abound after index has worst week since March

The S&P 500 index lost 2.93% last week as the Federal Reserve’s (Fed) September 20 policy meeting spooked investors with the central bank’s lack of interest in cutting interest rates anytime soon. 

Read more

Forex MAJORS

Cryptocurrencies

Signatures