- USD/CHF is now probably in a short-term uptrend, with odds favoring bullish bets.
- It has broken above the last lower high, a trendline and the 50 Simple Moving Average.
- The break above the key 0.8989 resistance level provided further confirmation.
USD/CHF is probably in a short-term uptrend after breaking above the key 0.8989 resistance level (June 11 high). The reversal in trend means the odds now favor more upside going forward.
USD/CHF 4-hour Chart
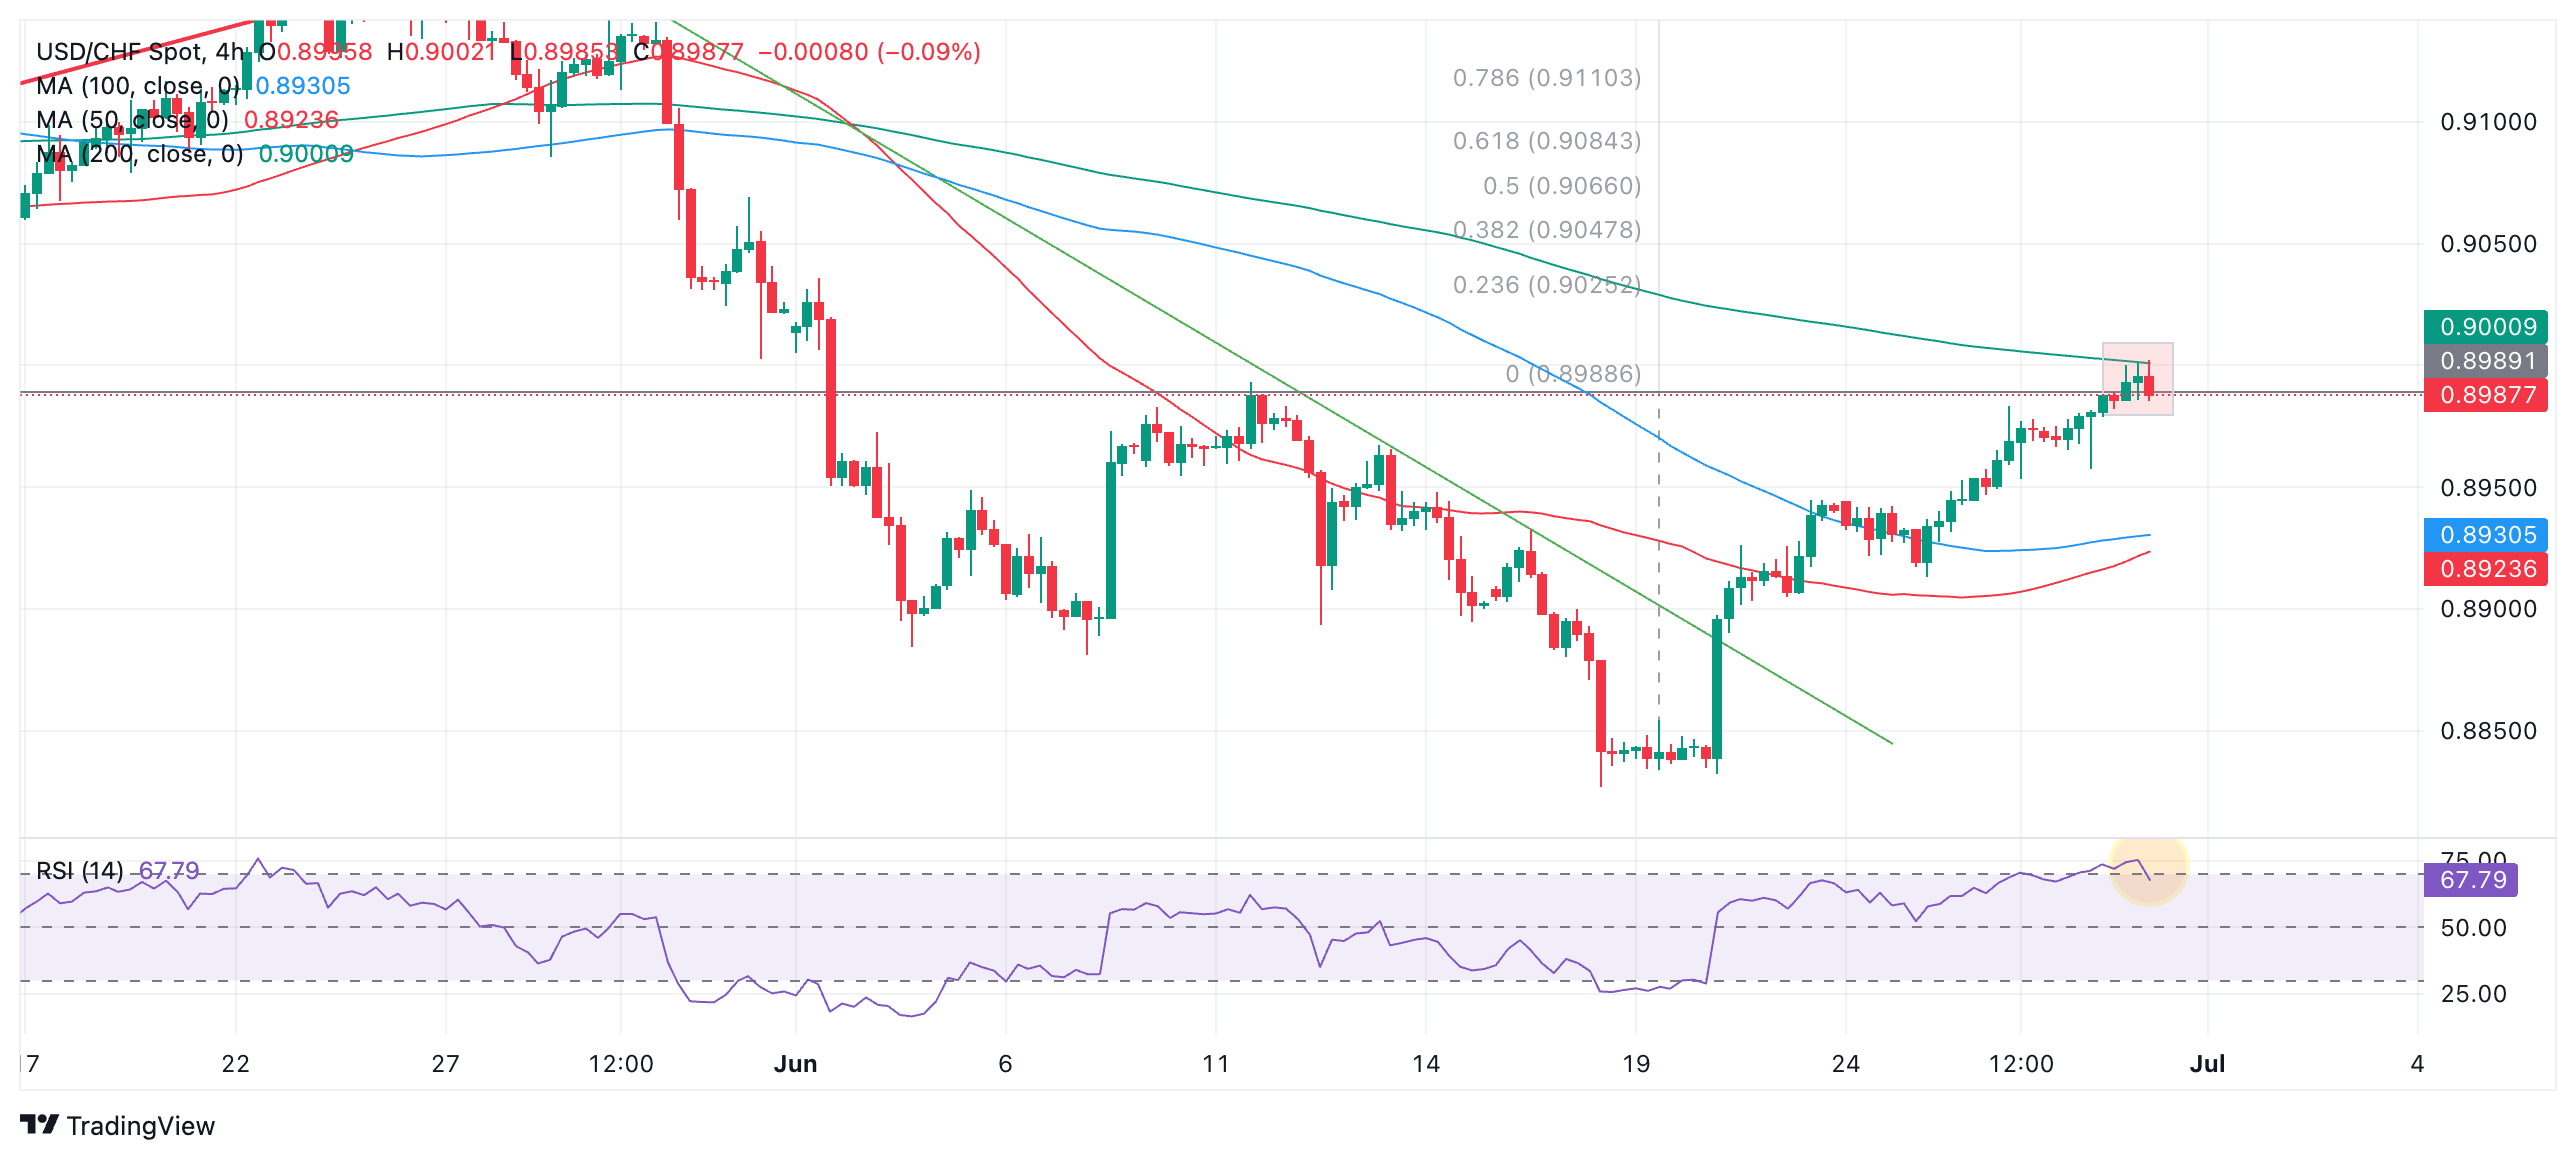
Upside targets for the pair lie at 0.9034 (50-day Simple Moving Average) followed by 0.9084, the 0.618 Fibonacci extension of the height of the bottoming pattern that evolved between June 11-27, and looks similar to a bullish Inverse Head and Shoulders (H&S) pattern. The distinctive square-shaped “head” that formed between June 18-20 is further evidence it might be an Inverse H&S.
A break on a closing basis clearly above 0.9000, and the green 200-period SMA would provide bullish confirmation of a continuation of the trend.
There are, however, signs a pullback may be evolving in the very near term. The Relative Strength Index (RSI) is overbought (shaded circle) and threatening to exit the overbought zone which would be a bearish sign. Whether or not it exits the overbought zone depends on how the current 4-hour bar closes. If it ends bullishly then the RSI will remain overbought; if bearishly it will exit overbought and suggest the beginning of a pullback.
Another sign a pullback may be developing is the Tweezer Top Japanese candlestick bearish reversal pattern (red shaded rectangle) that has formed over the past two candles. Tweezer tops occur at market tops when two bars both rise up to a similar high before closing back down near the middle of the candle. The pattern formed looks much like a "tweezer". It is a fairly reliable short-term reversal sign especially if followed by a bearish third candle. In this case the third candle is in the middle of completing so its not clear whether it will be red, however, it is at the time of writing.
A pullback, if it evolves, would be expected to fall to support at around the 0.8950s initially, from where it might turn around and begin rising again, in line with the dominant short-term uptrend.
Information on these pages contains forward-looking statements that involve risks and uncertainties. Markets and instruments profiled on this page are for informational purposes only and should not in any way come across as a recommendation to buy or sell in these assets. You should do your own thorough research before making any investment decisions. FXStreet does not in any way guarantee that this information is free from mistakes, errors, or material misstatements. It also does not guarantee that this information is of a timely nature. Investing in Open Markets involves a great deal of risk, including the loss of all or a portion of your investment, as well as emotional distress. All risks, losses and costs associated with investing, including total loss of principal, are your responsibility. The views and opinions expressed in this article are those of the authors and do not necessarily reflect the official policy or position of FXStreet nor its advertisers. The author will not be held responsible for information that is found at the end of links posted on this page.
If not otherwise explicitly mentioned in the body of the article, at the time of writing, the author has no position in any stock mentioned in this article and no business relationship with any company mentioned. The author has not received compensation for writing this article, other than from FXStreet.
FXStreet and the author do not provide personalized recommendations. The author makes no representations as to the accuracy, completeness, or suitability of this information. FXStreet and the author will not be liable for any errors, omissions or any losses, injuries or damages arising from this information and its display or use. Errors and omissions excepted.
The author and FXStreet are not registered investment advisors and nothing in this article is intended to be investment advice.
Recommended content
Editors’ Picks

EUR/USD retreats from session highs, holds above 1.0900
EUR/USD struggles to preserve its bullish momentum and retreats below 1.0950 after rising toward 1.1000 earlier in the day. Nevertheless, the risk-positive market atmosphere, as reflected by the bullish action seen in Wall Street, helps the pair hold its ground.

GBP/USD recovers toward 1.2800 on improving risk mood
GBP/USD continues to push higher toward 1.2800 in the second half of the day on Tuesday. The pair draws support from renewed US Dollar weakness and a positive shift in risk sentiment but US President Trump's tariff war and global growth concerns could limit its upside.

Gold rebounds toward $3,020 as trade war tensions remain high
Gold gathers bullish momentum and climbs toward $3,020 after suffering heavy losses on Monday. Improving market mood and rising US Treasury bond yields cap XAU/USD's upside, while a lack of headlines hinting at easing trade tensions supports the pair.

Who is Satoshi? Crypto lawyer sues DHS to reveal Satoshi Nakamoto's identity
James Murphy, a cryptocurrency lawyer popularly known to his followers on X as "MetalLawMan," has filed a lawsuit in a D.C. District Court against the Department of Homeland Security (DHS). He intends to uncover the real face or faces behind Satoshi Nakamoto, the pseudonymous creator of Bitcoin.

The Fed is looking at a hefty price level
We are still in thrall to tariffs, the faux-macro “data” driving markets. The WSJ editorial board advised other countries to take their tariffs to zero so that Trump’s “reciprocal” tariffs will have to be zero, too. Cute, but no cigar.

The Best brokers to trade EUR/USD
SPONSORED Discover the top brokers for trading EUR/USD in 2025. Our list features brokers with competitive spreads, fast execution, and powerful platforms. Whether you're a beginner or an expert, find the right partner to navigate the dynamic Forex market.