USD/CHF Price Analysis: Pokes 50-SMA hurdle below 0.9400 ahead of Swiss inflation release


  • USD/CHF picks up bids to pare the biggest daily loss in a month.
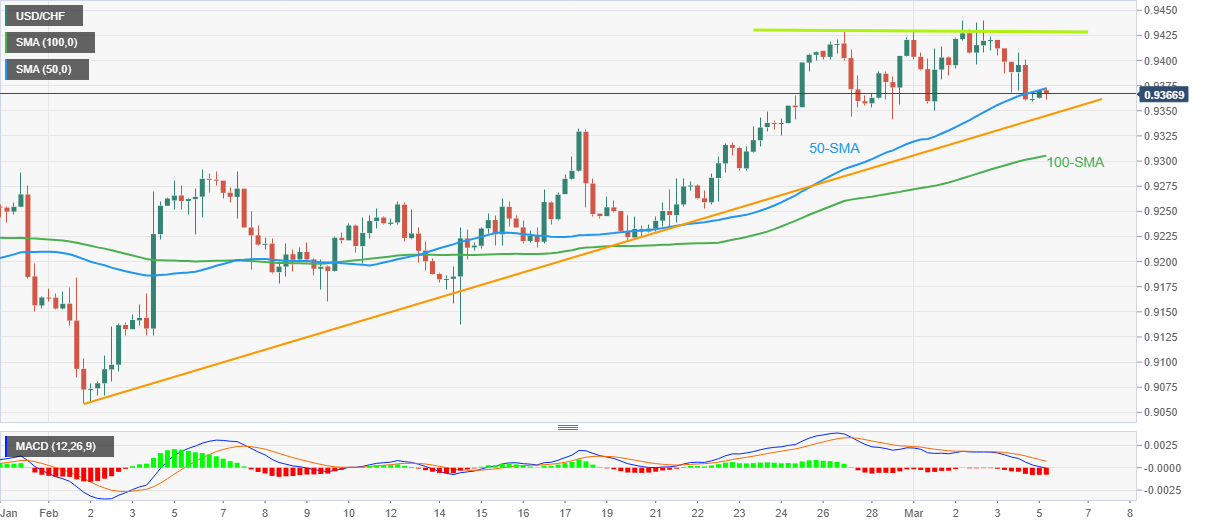
  • Bearish MACD signals, 50-SMA challenge recovery moves after snapping two-week uptrend.
  • One-month-old ascending support line, 100-SMA lures sellers during fresh declines.

USD/CHF struggles to defend the corrective bounce from 0.9360 as it jostles with the 50-SMA resistance during early Monday. In doing so, the Swiss currency pair portrays the cautious mood ahead of February’s Consumer Price Index (CPI) data from Switzerland, expected 2.9% YoY versus 3.3% previous readings.

Apart from the pre-data caution, the bearish MACD signals and a one-week-old horizontal resistance near 0.9430 also challenge the USD/CHF buyers.

Following that, the monthly high surrounding 0.9440 can act as a validation point for the rally targeting a late November 2022 swing high of near the 0.9600 threshold.

On the flip side, the 23.6% Fibonacci retracement of the pair’s February month upside, near 0.9350 restricts the immediate downside of the USD/CHF pair.

Even if the quote remains weak past 0.9350, an upward-sloping support line from early February and the 100-DMA, respectively near 0.9340 and 0.9300, may act as the last defense of the USD/CHF buyers.

Should the pair trade southwards past 0.9300, lows marked during February 2023, around 0.9135 and 0.9060, will be in focus.

Overall, USD/CHF is likely to remain on the bear’s radar unless the quote remains successfully above 0.9430.

USD/CHF: Four-hour chart

Trend: Further downside expected

Additional important levels

Overview
Today last price 0.9369
Today Daily Change 0.0007
Today Daily Change % 0.07%
Today daily open 0.9362
 
Trends
Daily SMA20 0.9292
Daily SMA50 0.9261
Daily SMA100 0.9435
Daily SMA200 0.9567
 
Levels
Previous Daily High 0.9424
Previous Daily Low 0.9359
Previous Weekly High 0.944
Previous Weekly Low 0.9342
Previous Monthly High 0.9429
Previous Monthly Low 0.9059
Daily Fibonacci 38.2% 0.9384
Daily Fibonacci 61.8% 0.9399
Daily Pivot Point S1 0.9339
Daily Pivot Point S2 0.9317
Daily Pivot Point S3 0.9274
Daily Pivot Point R1 0.9404
Daily Pivot Point R2 0.9447
Daily Pivot Point R3 0.947


Share: Feed news

Information on these pages contains forward-looking statements that involve risks and uncertainties. Markets and instruments profiled on this page are for informational purposes only and should not in any way come across as a recommendation to buy or sell in these assets. You should do your own thorough research before making any investment decisions. FXStreet does not in any way guarantee that this information is free from mistakes, errors, or material misstatements. It also does not guarantee that this information is of a timely nature. Investing in Open Markets involves a great deal of risk, including the loss of all or a portion of your investment, as well as emotional distress. All risks, losses and costs associated with investing, including total loss of principal, are your responsibility. The views and opinions expressed in this article are those of the authors and do not necessarily reflect the official policy or position of FXStreet nor its advertisers. The author will not be held responsible for information that is found at the end of links posted on this page.

If not otherwise explicitly mentioned in the body of the article, at the time of writing, the author has no position in any stock mentioned in this article and no business relationship with any company mentioned. The author has not received compensation for writing this article, other than from FXStreet.

FXStreet and the author do not provide personalized recommendations. The author makes no representations as to the accuracy, completeness, or suitability of this information. FXStreet and the author will not be liable for any errors, omissions or any losses, injuries or damages arising from this information and its display or use. Errors and omissions excepted.

The author and FXStreet are not registered investment advisors and nothing in this article is intended to be investment advice.

Recommended content


Recommended content

Editors’ Picks

EUR/USD turns negative near 1.0760

EUR/USD turns negative near 1.0760

The sudden bout of strength in the Greenback sponsored the resurgence of the selling pressure in the risk complex, dragging EUR/USD to the area of daily lows near 1.0760.

EUR/USD News

GBP/USD comes under pressure and challenges 1.2500

GBP/USD comes under pressure and challenges 1.2500

GBP/USD now rapidly loses momentum and gives away initial gains, returning to the 1.2500 region on the back of the strong comeback of the US Dollar.

GBP/USD News

Gold retreats from highs on stronger Dollar, yields

Gold retreats from highs on stronger Dollar, yields

XAU/USD trims part of its initial advance in response to the jump in the Dollar's buying interest and the re-emergence of the upside pressure in US yields.

Gold News

XRP tests support at $0.50 as Ripple joins alliance to work on blockchain recovery

XRP tests support at $0.50 as Ripple joins alliance to work on blockchain recovery

XRP trades around $0.5174 early on Friday, wiping out gains from earlier in the week, as Ripple announced it has joined an alliance to support digital asset recovery alongside Hedera and the Algorand Foundation. 

Read more

Week ahead – US inflation numbers to shake Fed rate cut bets

Week ahead – US inflation numbers to shake Fed rate cut bets

Fed rate-cut speculators rest hopes on US inflation data. After dovish BoE, pound traders turn to UK job numbers. Will a strong labor market convince the RBA to hike? More Chinese data on tap amid signs of slow Q2 start.

Read more

Forex MAJORS

Cryptocurrencies

Signatures