|

USD/CAD Prior Analysis: Bears taking on bullish commitments near 1.3450 key area

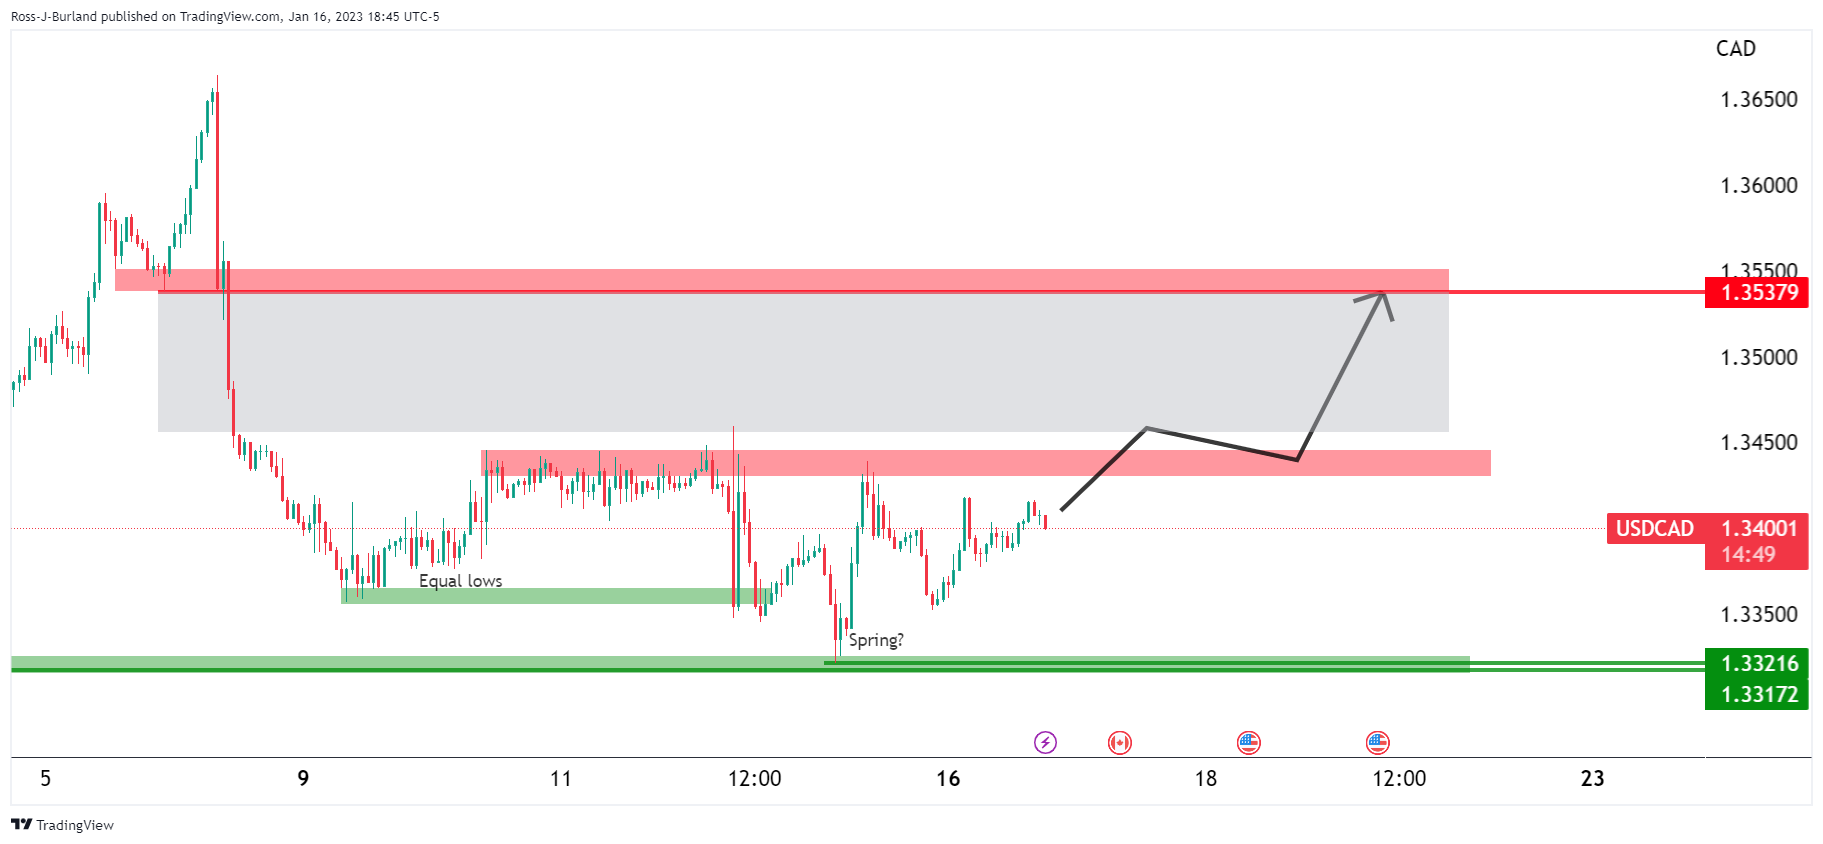
  • USD/CAD bears are taking on a double bottom near 1.3450 support area.
  • Bears eye a 61.8% Fibonacci retracement near 1.3415 should the double bottom (DB) be breached. 

USD/CAD is eating into the bullish rally's tracks from yesterday's business with 1.3450/30 eyed as a potential support structure in what has been a choppy descent from above 1.3500 on the day so far. The following illustrates the downside bias prior to the next wave of demand to the upside should the US dollar bulls be motivated by a discount in price in the coming sessions and days ahead. 

USD/CAD prior analysis

It was stated at the start of the week, in the following analysis, USD/CAD Price Analysis: Bulls eye a break of 1.3450 for a look in at the 1.35 area, that the price was embarking on a correction but 1.3450 had to give out first: 
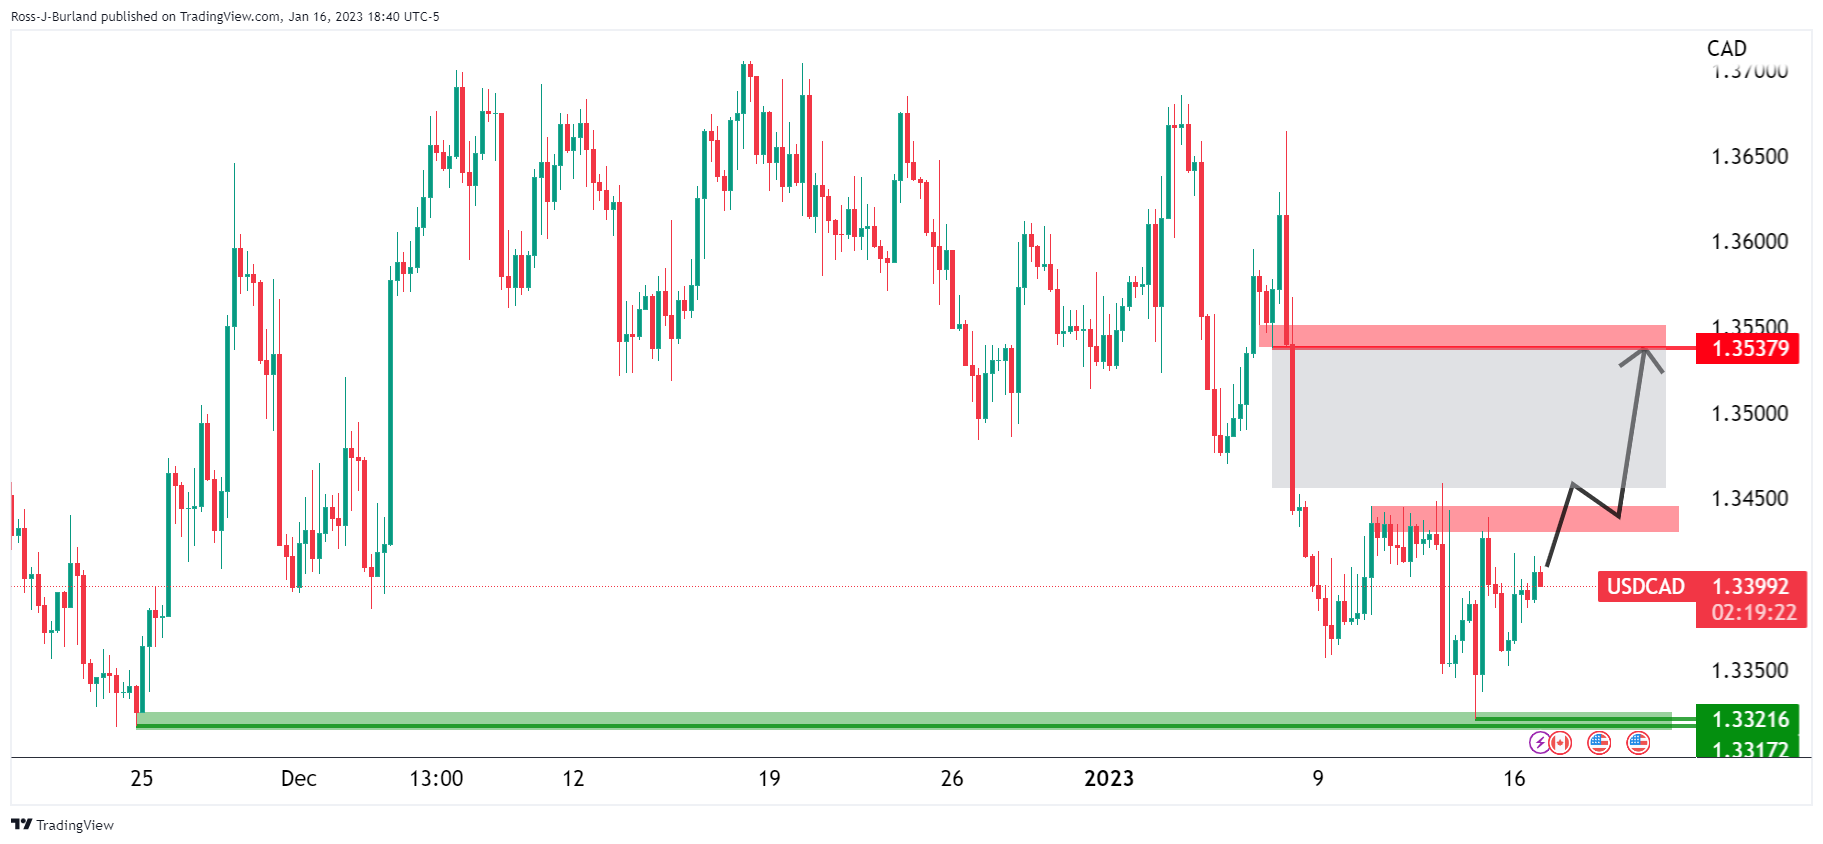
There was a price imbalance that had been left behind since the major sell-off at the start of the year. There was a thesis of mitigation towards 1.3550. 

USD/CAD update
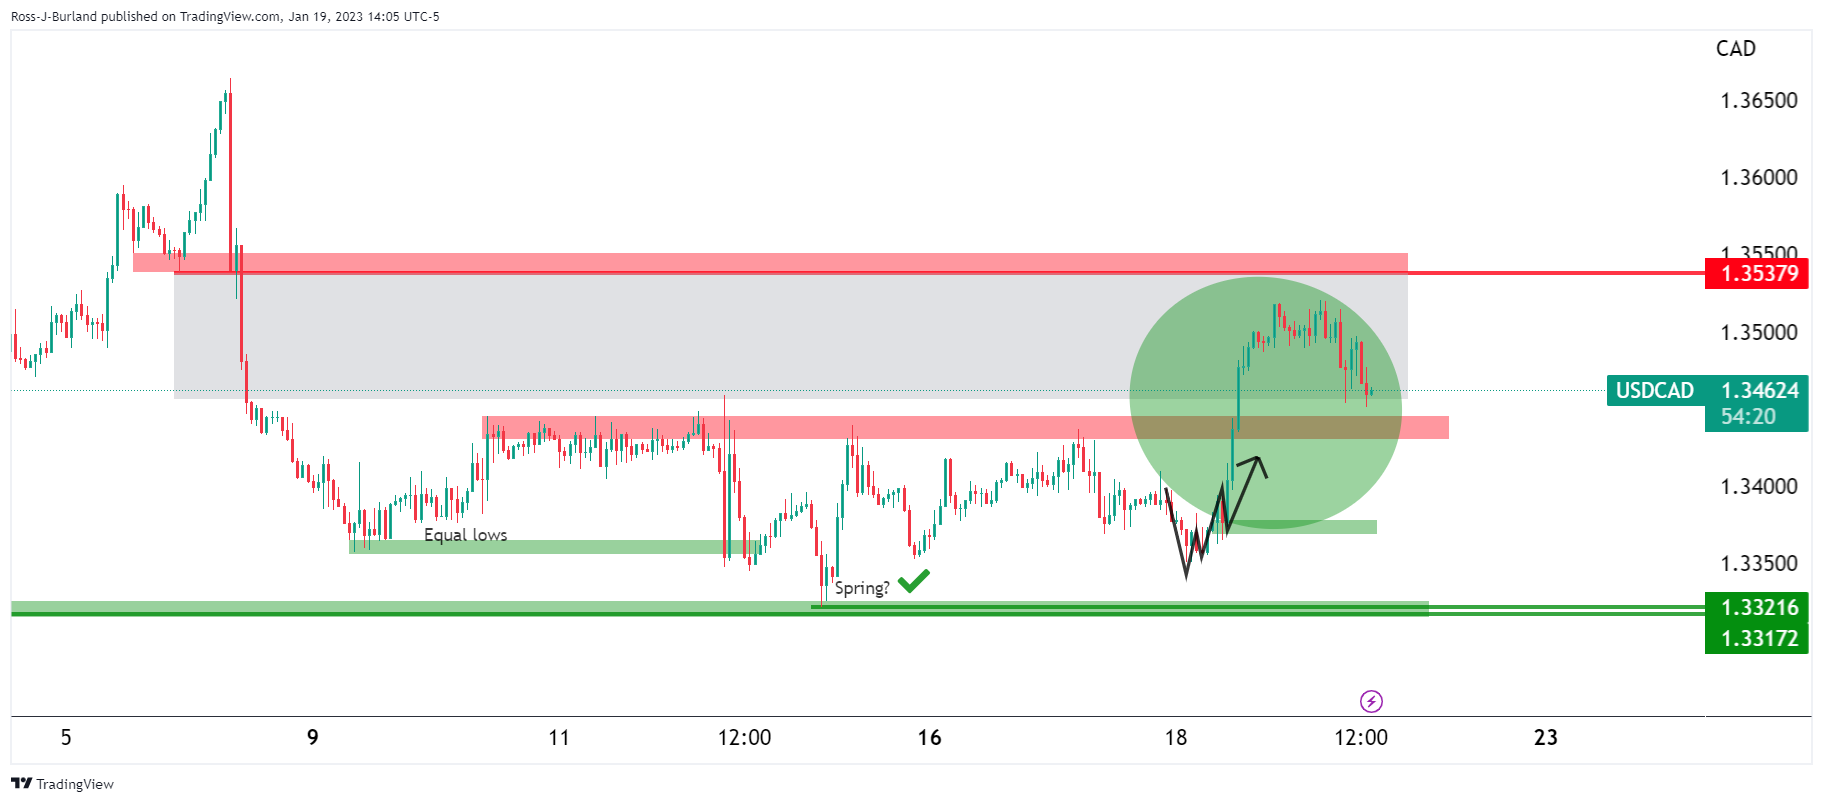
As illustrated, the bullish accumulation schematic played out, with the price respecting the spring and a subsequent break of resistance near 1.3450 leading to a drive to mitigate the price imbalance, albeit not in its entirety. 

At this juncture, it is a matter of wait-and-see, but the bias is bullish while above the old resistance:

USD/CAD H4 chart
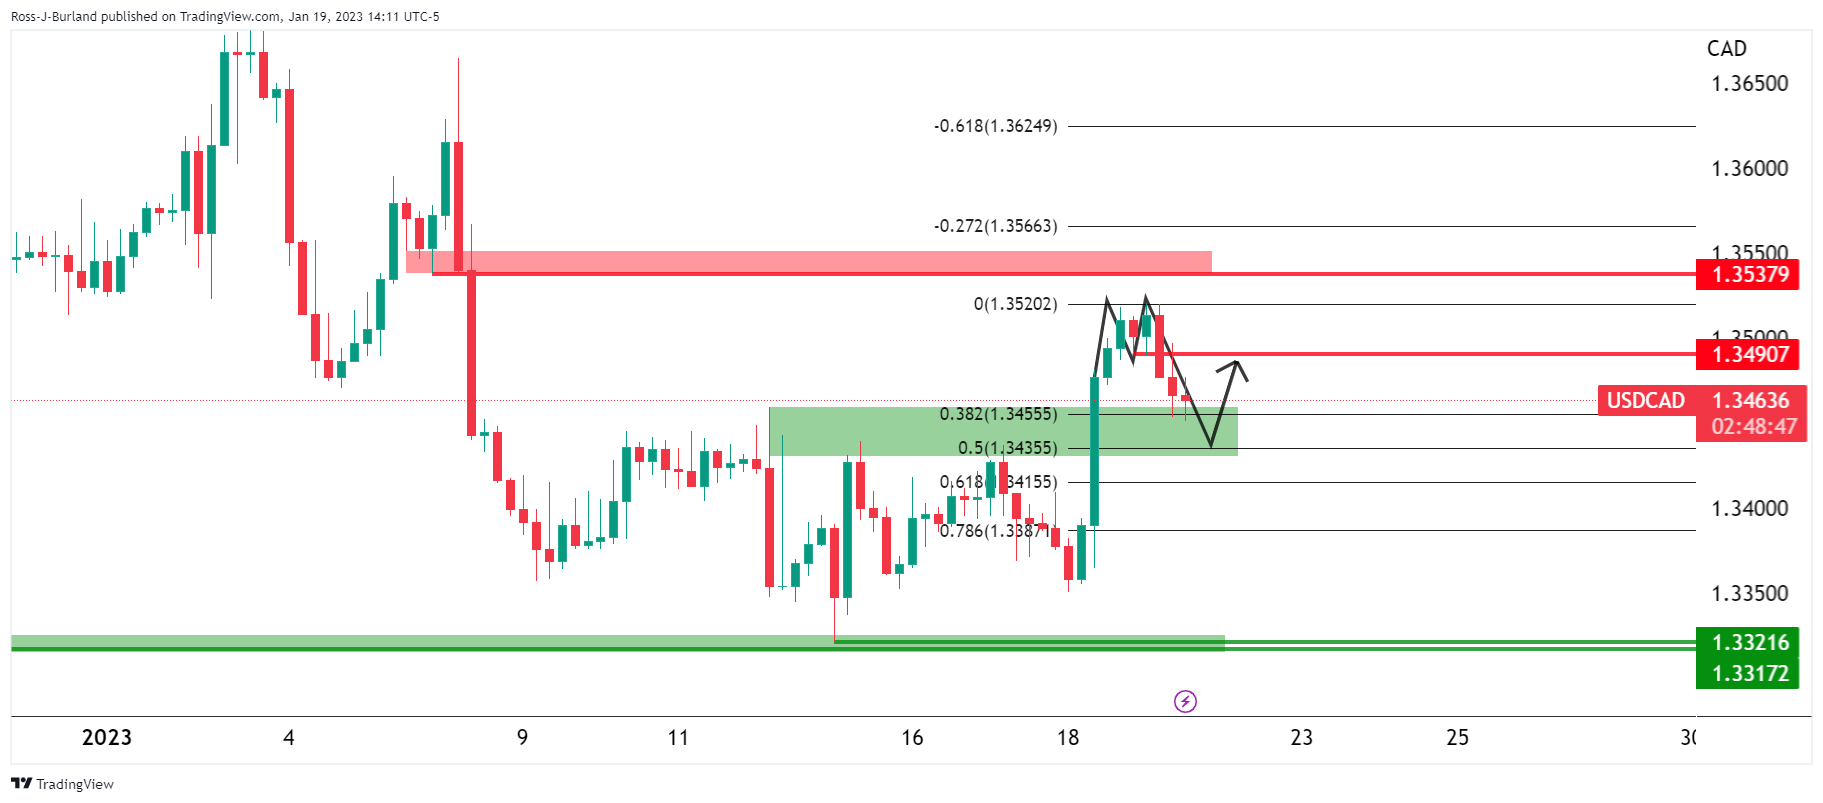
The price is forming an M-formation on the 4-hour chart. The pattern is a reversion set-up for the sessions ahead where the price would be expected to move back into the bearish impulse and target the neckline near 1.3490. However, the downside may not have been concluded as of yet, although there is a current deceleration near 1.3450 and a 38.2% Fibonacci retracement area of the prior bullish leg's range. Lower time frames can be assessed to gauge whether the bears are throwing in the towel which might prompt a move by the bulls in the day ahead: 

USD/CAD 15-min chart
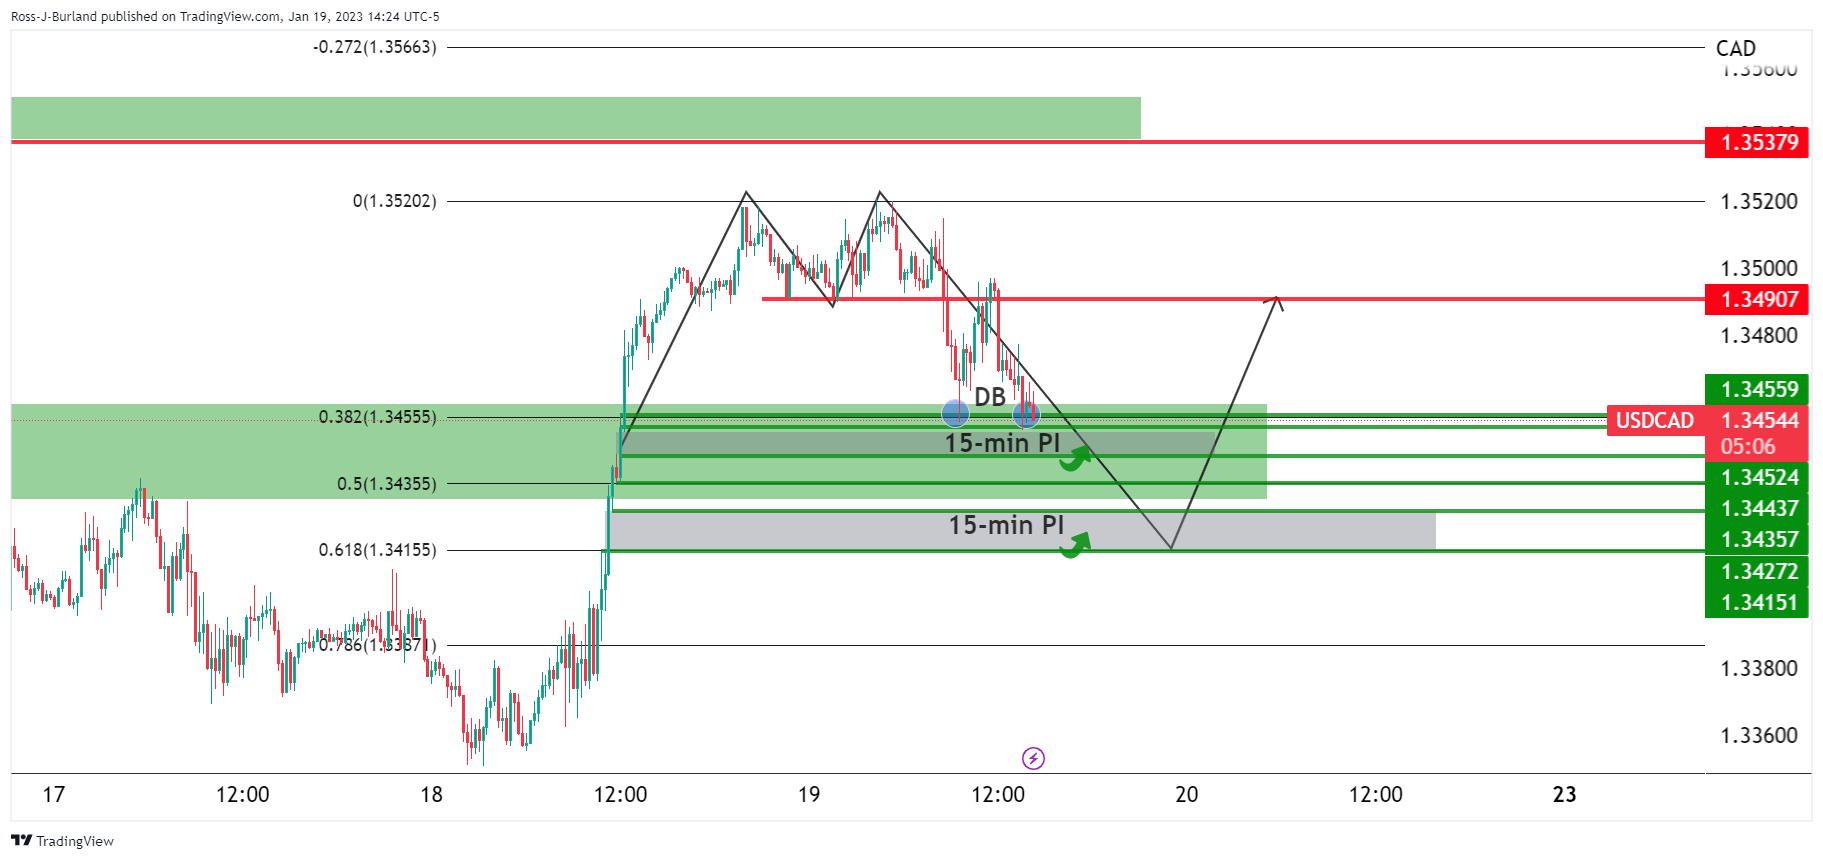
As per the 15-min chart, there are two price imbalances (PIs) that could be mitigated on the way to a 61.8% Fibonacci retracement near 1.3415 should the double bottom (DB) be breached. 

Author

Ross J Burland

Ross J Burland, born in England, UK, is a sportsman at heart. He played Rugby and Judo for his county, Kent and the South East of England Rugby team.


More from Ross J Burland
Share:

Editor's Picks

AUD/USD flirts with 0.7000, lowest since early August amid bullish USD

AUD/USD hits a fresh low since early August during the Asian session on Friday and looks vulnerable near 0.7000 after breaking below the 200-day SMA overnight. Against the backdrop of the hawkish Fed, a two-day rally in oil prices revives inflation fears and continues to push US bond yields to multi-year highs. Adding to this, geopolitical risks lift the US Dollar to a two-month high, overshadowing RBA rate hike bets and weighing on the pair.

USD/JPY pulls back from three-week high after failing near 159.00

USD/JPY edges lower during the Asian session on Friday, stalling its recent strong move to a three-week high of 159.00 as Japanese Yen bears turn cautious amid intervention fears. Meanwhile, the US Dollar retains a strong bullish undertone as the Fed's hawkish outlook and oil-driven inflation fears continue to push US bond yields to multi-year peaks. Furthermore, the BoJ's dovish rate hike last week might cap JPY and support spot prices.

Gold treads water below $4,300

Gold grabs some buying attention and advances marginally at the end of the week, partially retracing the weekly decline, although it is still navigating below the key $4,300 mark per troy ounce. The fresh selling bias on the Greenback and the modest decline in US Treasury yields appear to support the humble advance in the precious metal.

Crypto Today: Bitcoin and Ethereum edge lower, XRP extends recovery as macro headwinds weigh

The broader cryptocurrency market is consolidating on Friday, with Bitcoin paring losses slightly above $84,000. Ethereum declines in tandem with BTC. Ripple (XRP), meanwhile, paints a different picture.


Fed vs BoJ: Both hiked. The market only believes one of them – and the chart shows which
The Federal Reserve (Fed) and the Bank of Japan (BoJ) have just done something remarkably similar. Both central banks raised interest rates by 25 basis points (bps) last week, both are confronting inflation risks, and both signal that future decisions will depend on incoming economic data.
Fed vs BoJ: Both hiked. The market only believes one of them – and the chart shows which

The Fed and the BoJ have just done something remarkably similar. Both central banks raised interest rates by 25 bps last week, both are confronting inflation risks, and both signal that future decisions will depend on incoming economic data.