USD/CAD Price Forecast: Tests lower boundary of the ascending channel below 1.3600
- USD/CAD tests the lower boundary of the ascending channel, which suggests a potential weakening of the bullish bias.
- The pair’s price remains above both the nine-day and 14-day EMAs, indicating that bullish momentum is still in play.
- The 1.3590 level, where "throwback support turns into pullback resistance," serves as the immediate barrier.

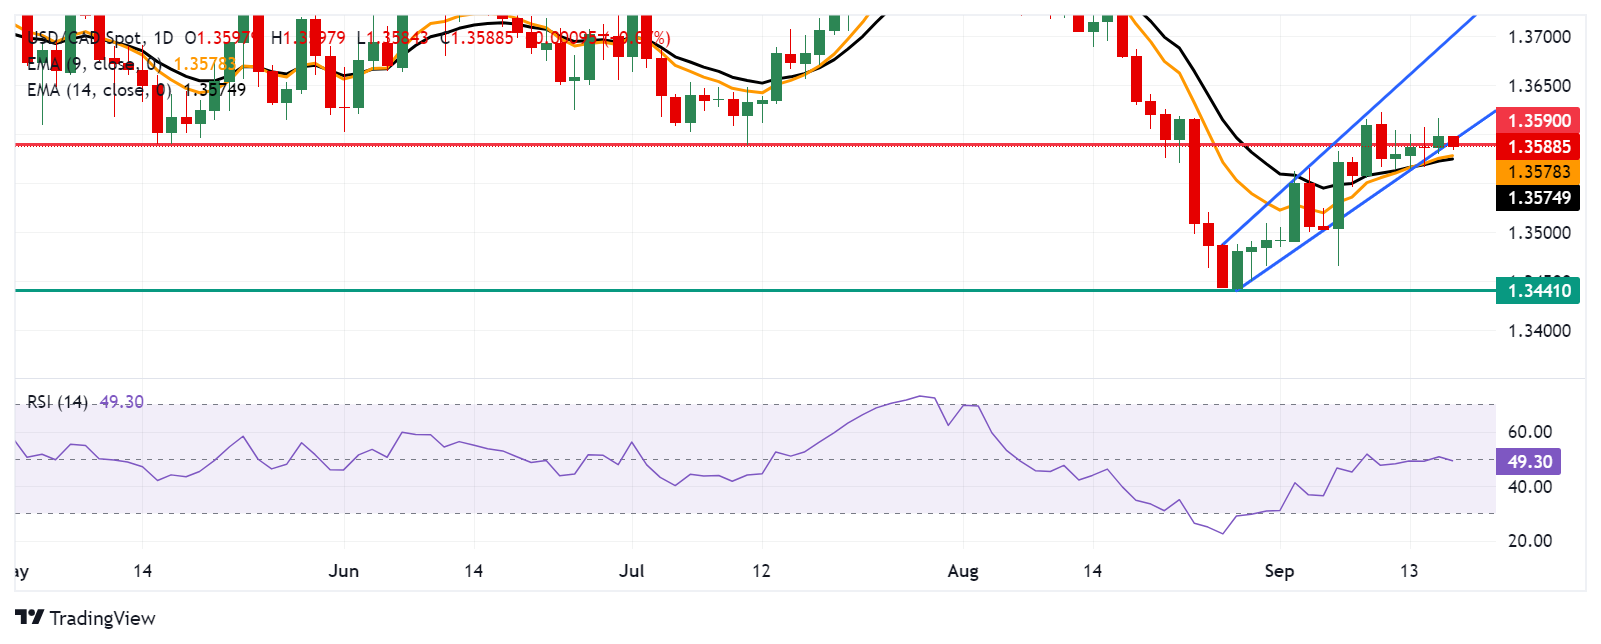
USD/CAD trades around 1.3590 during Wednesday’s European hours. Analysis of the daily chart suggests a potential weakening of the bullish bias for the USD/CAD pair, as it is testing the lower boundary of the ascending channel pattern.
Additionally, the 14-day Relative Strength Index (RSI) is slightly below the 50 level. Further movement in the RSI will provide a clearer indication of the directional trend for the USD/CAD pair.
However, the nine-day Exponential Moving Average (EMA) is positioned slightly above the 14-day EMA, indicating that the short-term trend is stronger than the longer-term trend. The price of the USD/CAD pair remains above both the nine-day and 14-day EMAs, suggesting that bullish momentum is still in play.
On the downside, a break below the lower boundary of the ascending channel would weaken the bullish bias and lead the USD/CAD pair to test the nine-day EMA at the 1.3578 level, which aligns closely with the 14-day EMA at 1.3575. A breach below these EMAs could trigger a bearish trend, potentially pressuring the pair to move toward the six-month low of 1.3441, recorded on August 28.
Regarding the upside, the immediate barrier is at the "throwback support turns into a pullback resistance" level of 1.3590, followed by the psychological level of 1.3600. Additional resistance may emerge at the upper boundary of the ascending channel, around the 1.3700 level.
USD/CAD: Daily Chart
Canadian Dollar PRICE Today
The table below shows the percentage change of Canadian Dollar (CAD) against listed major currencies today. Canadian Dollar was the strongest against the US Dollar.
| USD | EUR | GBP | JPY | CAD | AUD | NZD | CHF | |
|---|---|---|---|---|---|---|---|---|
| USD | -0.14% | -0.34% | -0.45% | -0.06% | -0.32% | -0.54% | -0.40% | |
| EUR | 0.14% | -0.21% | -0.33% | 0.08% | -0.17% | -0.42% | -0.26% | |
| GBP | 0.34% | 0.21% | -0.09% | 0.29% | 0.04% | -0.21% | -0.03% | |
| JPY | 0.45% | 0.33% | 0.09% | 0.39% | 0.13% | -0.07% | 0.08% | |
| CAD | 0.06% | -0.08% | -0.29% | -0.39% | -0.27% | -0.48% | -0.32% | |
| AUD | 0.32% | 0.17% | -0.04% | -0.13% | 0.27% | -0.21% | -0.06% | |
| NZD | 0.54% | 0.42% | 0.21% | 0.07% | 0.48% | 0.21% | 0.15% | |
| CHF | 0.40% | 0.26% | 0.03% | -0.08% | 0.32% | 0.06% | -0.15% |
The heat map shows percentage changes of major currencies against each other. The base currency is picked from the left column, while the quote currency is picked from the top row. For example, if you pick the Canadian Dollar from the left column and move along the horizontal line to the US Dollar, the percentage change displayed in the box will represent CAD (base)/USD (quote).
Author

Akhtar Faruqui
FXStreet
Akhtar Faruqui is a Forex Analyst based in New Delhi, India. With a keen eye for market trends and a passion for dissecting complex financial dynamics, he is dedicated to delivering accurate and insightful Forex news and analysis.


