|

USD/CAD Price Analysis: Threatening to break out of triangle price pattern

  • USD/CAD is attempting to break out of a triangle price pattern and push higher. 
  • A decisive breakout would reaffirm 2024’s uptrend and begin a new more bullish phase.

USD/CAD is pushing up against the upper borderline of a large symmetrical triangle price pattern, threatening to break out to the upside. 

USD/CAD Daily Chart
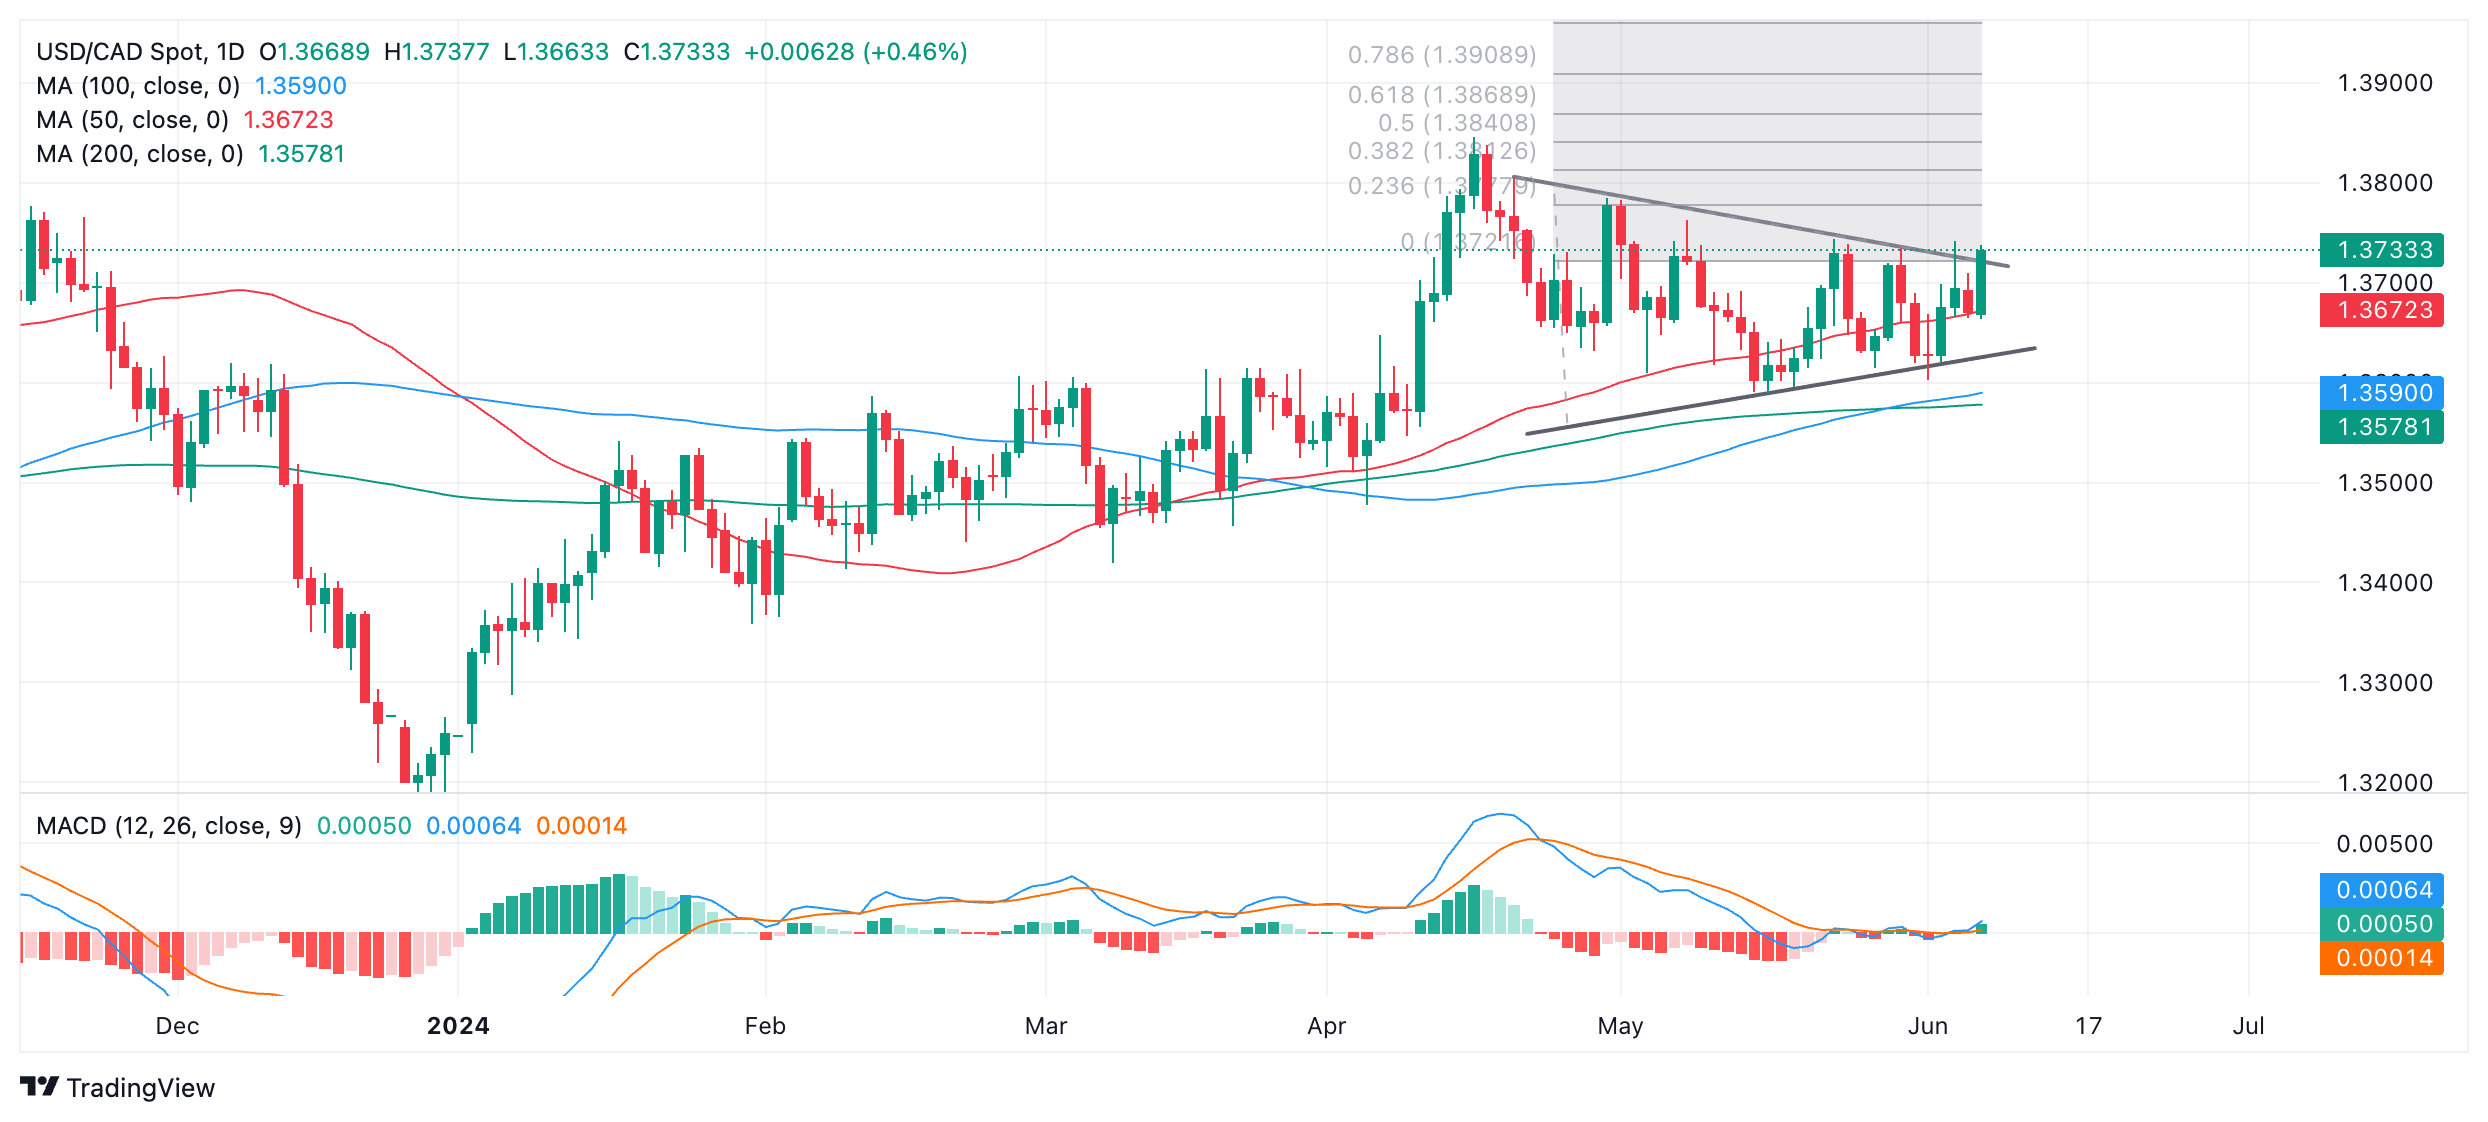
A decisive breakout from the triangle would activate the initial upside target for the pattern at 1.3869, the 0.618 Fibonacci extrapolation of the height of the triangle from the breakout point higher. 

A decisive break would be one accompanied by a long green daily candlestick that broke clearly through the level and closed near its high or three green candlesticks in a row that broke through the level. 

USD/CAD has broadly-speaking been in an uptrend since the start of 2024. During that time it has risen from the 1.31s to the current 1.37s. Given that “the trend is your friend” the odds favor a continuation of the bull trend. 

Since April USD/CAD has been trading sideways in a narrowing range like a triangle. This is a type of continuation pattern. The probabilities favor price breaking out to the upside in line with the prior trend. The pattern has also completed five internal waves which is the minimum requirement for a triangle. 

The breakout, when it happens, is likely to be quite volatile. Traders should be warned that false breakouts are quite common. For more confidence a move above 1.3762 (May 8 high) should be used as confirmation. 

A decisive breakdown from the triangle would reverse the trend and suggest a move down to an initial target at around 1.3483. 

Author

Joaquin Monfort

Joaquin Monfort is a financial writer and analyst with over 10 years experience writing about financial markets and alt data. He holds a degree in Anthropology from London University and a Diploma in Technical analysis.


More from Joaquin Monfort
Share:

Editor's Picks

GBP/USD holds range below mid-1.3600s amid Fed risks and Iran tensions

The GBP/USD pair extends its sideways consolidative price move for the second straight day, and trades around the 1.3630 area during the Asian session. The US Dollar is looking to build on its modest recovery from the lowest level since May 14, and is acting as a headwind for the currency pair. The lack of follow-through selling warrants some caution for bearish traders.

EUR/USD gains support amid hawkish ECB expectations, subdued US Dollar

EUR/USD inches higher after posting minor losses in the previous day, trading around 1.1670 during the Asian hours. The pair finds support as rising oil prices, elevated bond yields, and escalating Middle East tensions drive Eurozone inflation concerns. These factors have boosted expectations for a more hawkish stance from the European Central Bank, which is widely anticipated to deliver a 25-basis-point rate hike in September.

$4700 tested as Gold pulls back but bullish potential remains intact
Gold has pulled back sharply from fresh 15-week highs of $4,697, snapping a two-day uptrend in Asia on Tuesday. The US Dollar (USD) holds onto recovery gains, capping further upside in the bullion.
Bitcoin tops $80,000 as US Treasury fights high yields – AERO, VIRTUAL rally

Bitcoin extends gains above $80,000 as broader market risk-on sentiment persists. The scarce asset could extend its rally as the US Treasury combats high yields in the long-dated bond market, with further interventions on the horizon. Aerodrome Finance (AERO) and Virtuals Protocol (VIRTUAL) emerged as top performers over the last 24 hours.

The forex market is switching to a ‘debasement trade’
The US dollar has stabilised near three-month lows thanks to a rapid recovery in Treasury bond yields. Yields on 30-year bonds are returning to the levels seen following the Treasury’s announcement that it was increasing the minimum purchase volume to $4 billion. The greenback got support from falling stock indices, the continued rally in Brent crude, and positive signals from the US economy.
$20 billion offered, $2 billion taken: Why Treasury doubled its buyback cap

The US Treasury moved off its own calendar on Wednesday, and that is the part worth sitting with. At 12:32 GMT, the department said it would at least double the size of liquidity support buyback operations in the 10-year to 20-year and 20-year to 30-year sectors, lifting the maximum from $2 billion per operation to at least $4 billion, effective September 9 and running to November 4.