|

USD/CAD Price Analysis: The end of the rally is nigh according to market structure

  • USD/CAD could be about to turn and eyes are on the downside. 
  • Bearish engulfing close to confirm the prospects of a move towards the 38.2% and 50% ratios.

USD/CAD has continued to rally despite what some might perceive to be overextended conditions. The question traders are asking is whether this is now the top?

The US dollar is on fire due to fundamentals yet commodities could be on the verge of a move higher which would lend support to CAD.

Either way, from a technical standpoint, we can assess the price action and multi time frame market structures to determine the probabilities of whether this is, at least, a meanwhile top.

The following analysis will illustrate that USD/CAD's market structure and price action are turning bearish.

USD/CAD monthly chart

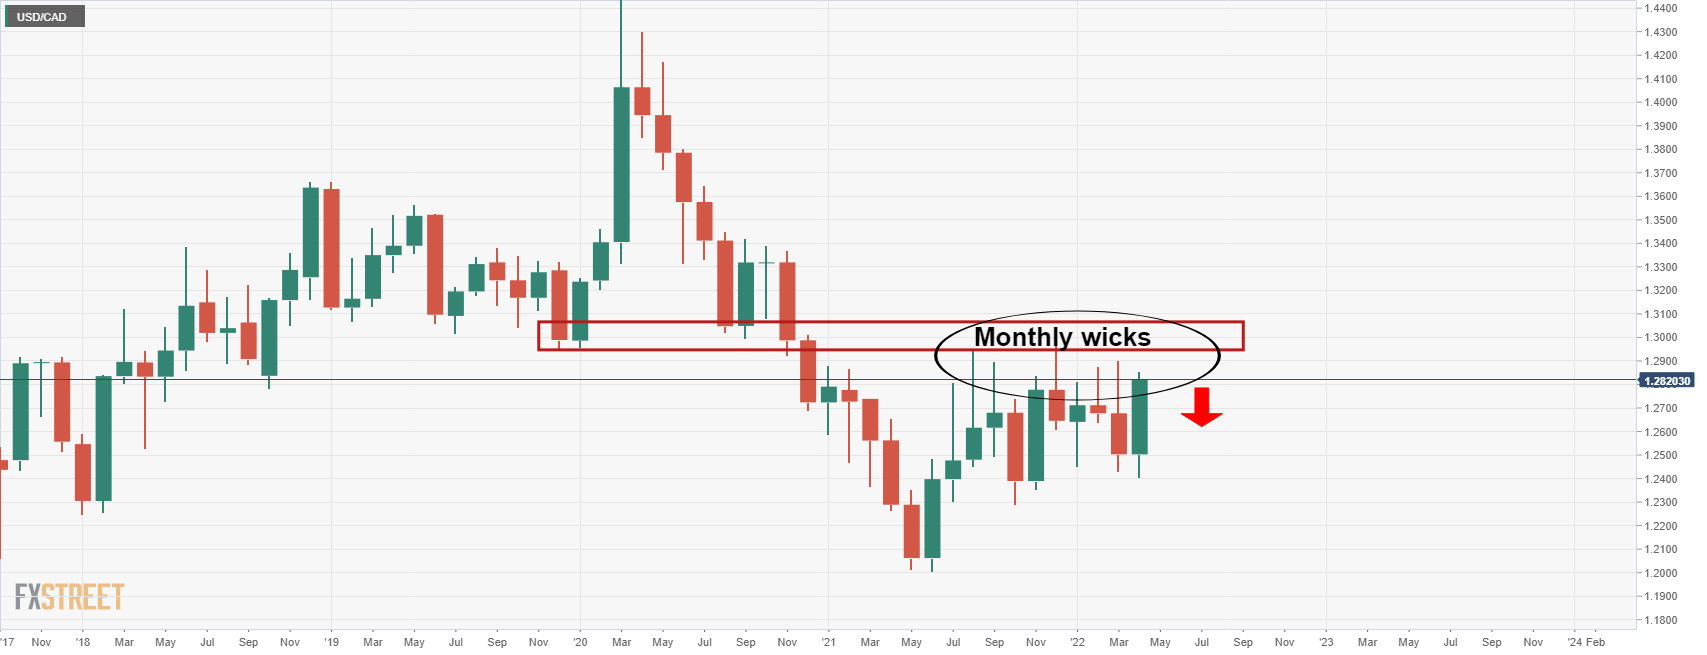
The monthly time frame shows multiple failures below resistance and while there is scope for a push to 1.30 the figure, given the strength of April's candle, it is probable that there will need to be a retracement in the coming days before the next push higher. 

USD/CAD weekly chart

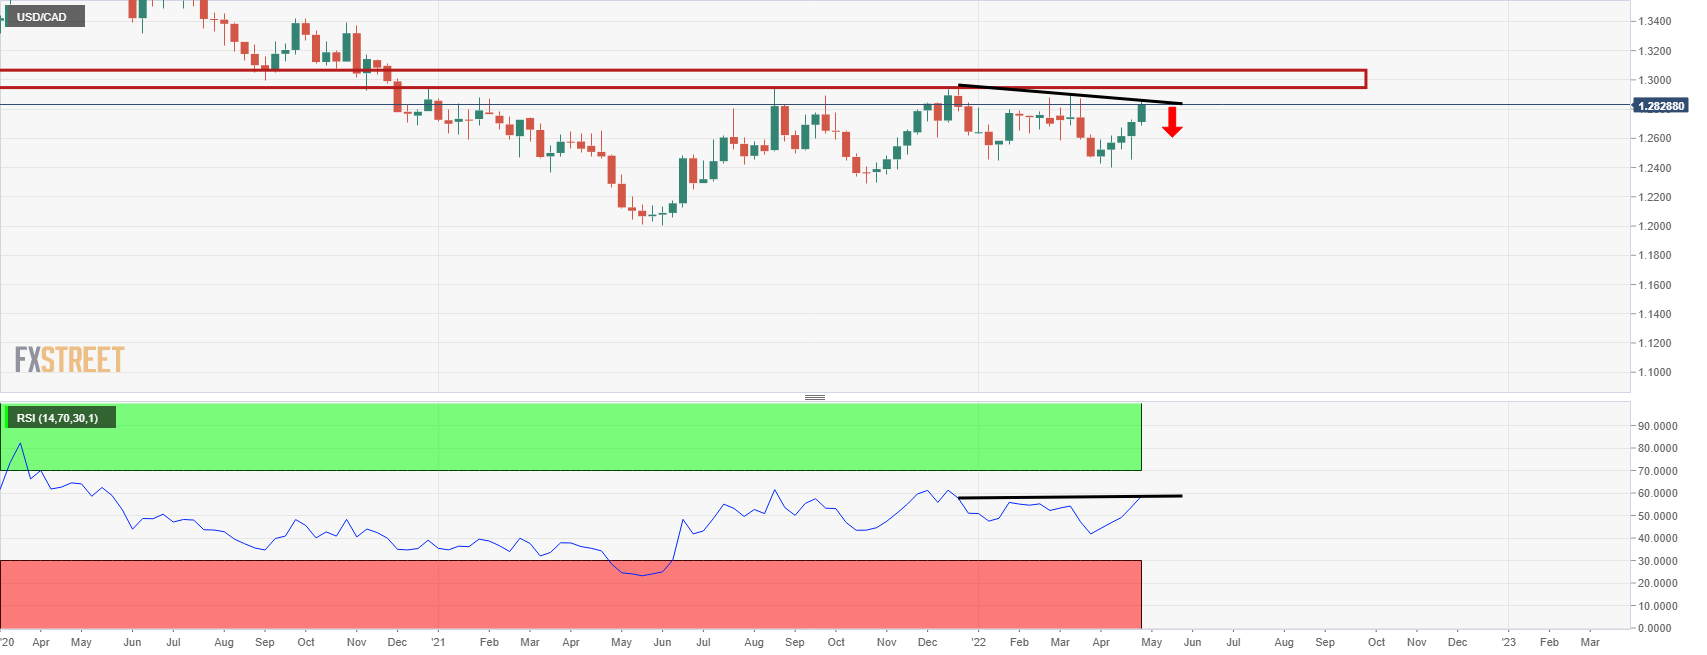
We could have some hidden bearish divergence on the weekly time frame if the price forms a lower high for the week and the daily chart could give us some clues. 

USD/CAD daily chart

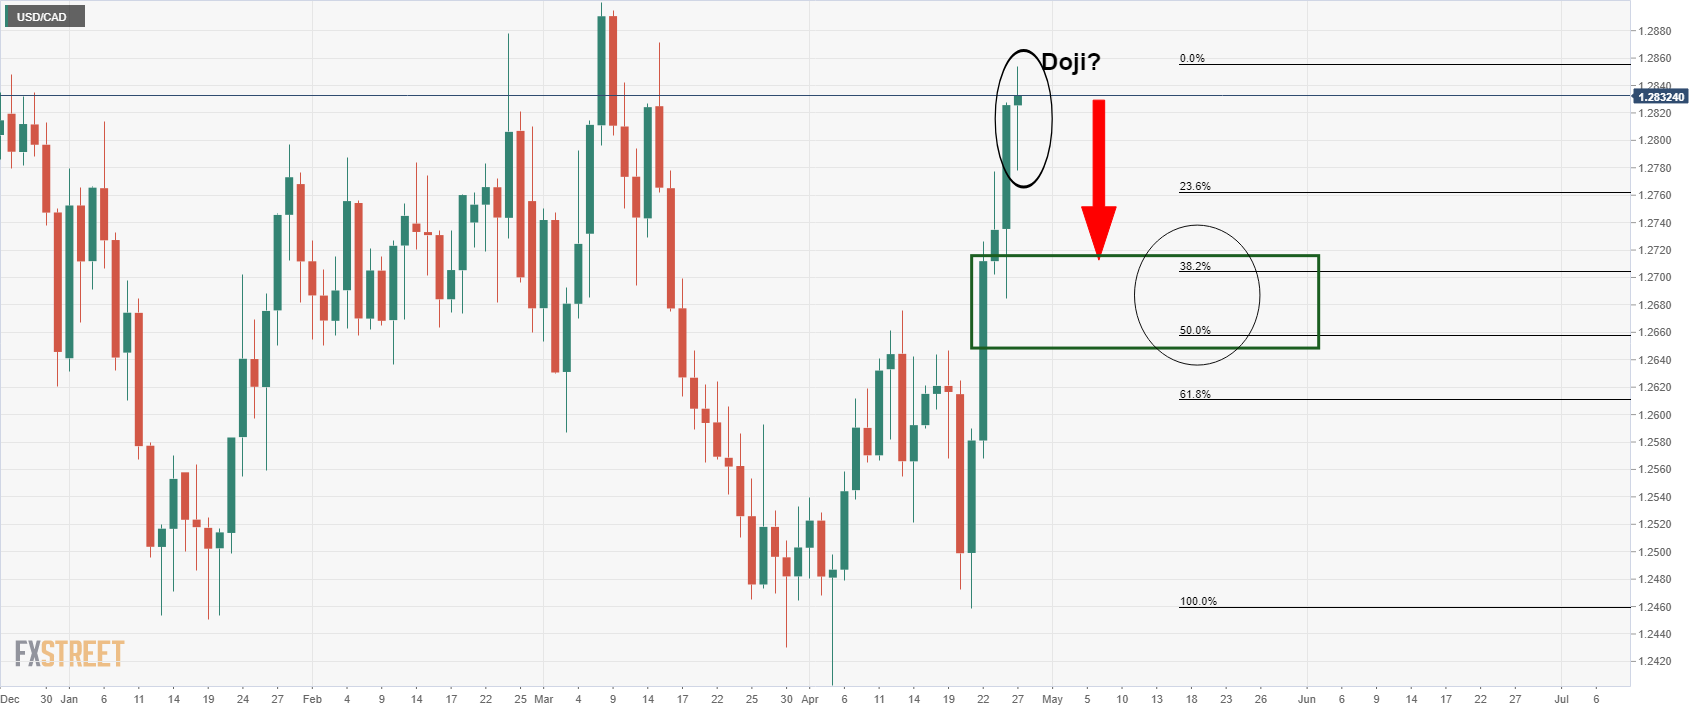
The price could be forming a daily doji and the bears will be looking for this to be followed by a bearish engulfing close on Thursday to confirm the prospects of a move towards the 38.2% and 50% ratios along the Fibonacci scale that have a confluence with the prior structures. 

Author

Ross J Burland

Ross J Burland, born in England, UK, is a sportsman at heart. He played Rugby and Judo for his county, Kent and the South East of England Rugby team.

More from Ross J Burland
Share:

Markets move fast. We move first.

Orange Juice Newsletter brings you expert driven insights - not headlines. Every day on your inbox.

By subscribing you agree to our Terms and conditions.

Editor's Picks

EUR/USD recovers to 1.1750 region as 2025 draws to a close

Following the bearish action seen in the European session on Wednesday, EUR/USD regains its traction and recovery to the 1.1750 region. Nevertheless, the pair's volatility remains low as trading conditions thin out on the last day of the year.

GBP/USD stays weak near 1.3450 on modest USD recovery

GBP/USD remains under modest beairsh pressure and fluctuates at around 1.3450 on Wednesday. The US Dollar finds fresh demand due to the end-of-the-year position adjustments, weighing on the pair amid the pre-New Year trading lull. 

Gold retreats to $4,300 area, looks to post monthly gains

Gold stays on the back foot on the last day of 2025 and trades near $4,300, possibly pressured by profit-taking and position adjustments. Nevertheless, XAU/USD remains on track to post gains for December and extend its winning streak into a fifth consecutive month.

Bitcoin, Ethereum and XRP prepare for a potential New Year rebound

Bitcoin, Ethereum, and Ripple are holding steady on Wednesday after recording minor gains on the previous day. Technically, Bitcoin could extend gains within a triangle pattern while Ethereum and Ripple face critical overhead resistance. 

Economic outlook 2026-2027 in advanced countries: Solidity test

After a year marked by global economic resilience and ending on a note of optimism, 2026 looks promising and could be a year of solid economic performance. In our baseline scenario, we expect most of the supportive factors at work in 2025 to continue to play a role in 2026.

Crypto market outlook for 2026

Year 2025 was volatile, as crypto often is.  Among positive catalysts were favourable regulatory changes in the U.S., rise of Digital Asset Treasuries (DAT), adoption of AI and tokenization of Real-World-Assets (RWA).