|

USD/CAD Price Analysis: Rises above 1.3550 ahead of Canadian CPI, Fed policy

  • USD/CAD climbs above 1.3550 amid uncertainty ahead of key events.
  • Canadian inflation is forecasted to have accelerated in February.
  • Investors will keenly focus on the Fed’s interest rate guidance.

The USD/CAD pair jumps to 1.3550 in Tuesday’s European session after breaking above the two-day consolidation formed in a range of 1.3510-1.3550. The Loonie asset advances as uncertainty ahead of key events has dampened risk appetite of market participants.

S&P500 futures have generated nominal losses in the London session, indicating a risk-aversion mood. The US Dollar Index (DXY) continues its winning spell for the fourth trading session and refreshes its weekly high at 103.87 amid uncertainty ahead of the interest rate decision by the Federal Reserve (Fed), which will be announced on Wednesday.

The CME FedWatch tool shows that the central bank is certain to keep interest rates unchanged in the range of 5.25%-5.50%. Investors will focus on cues about rate cuts by the Fed, which are currently expected in the June policy meeting.

Meanwhile, the next move in the Canadian Dollar will be guided by Canada’s Consumer Price Index (CPI) data for February, which will be published at 12:30 GMT. Annual headline inflation is expected to have grown at a higher pace of 3.1% compared to 2.9% recorded for January.

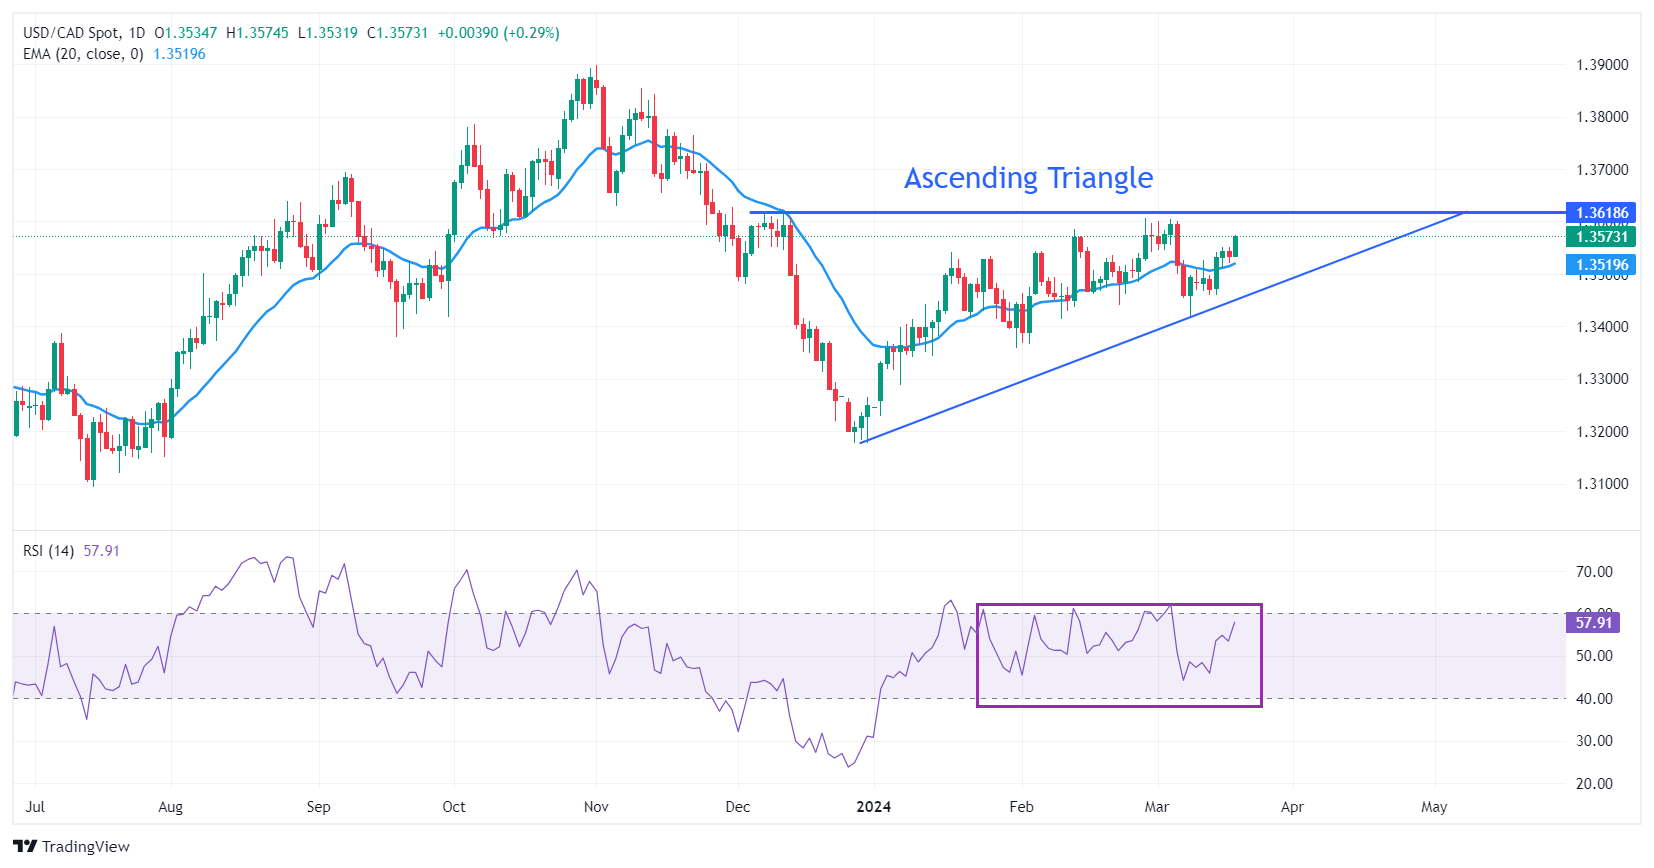
USD/CAD approaches the horizontal resistance of the Ascending Triangle pattern formed on a daily timeframe, plotted from December 7 high at 1.3620. The upward-sloping border of the aforementioned pattern is placed from December 27 low at 1.3177. The chart pattern exhibits a sharp volatility contraction.

The near-term appeal is bullish, as the 20-day Exponential Moving Average (EMA) near 1.3520 continues to support the US Dollar bulls.

The 14-period Relative Strength Index (RSI) oscillates inside the 40.00-60.00 range, indicating indecisiveness among investors.

The Loonie asset would observe a fresh upside if it breaks above December 7 high at 1.3620. This will drive the asset towards May 26 high at 1.3655, followed by the round-level resistance of 1.3700.

On the flip side, a downside move below February 22 low at 1.3441 would expose the asset to February 9 low at 1.3413. A breakdown below the latter would extend downside towards January 15 low at 1.3382.

USD/CAD daily chart

USD/CAD

Overview
Today last price1.3571
Today Daily Change0.0037
Today Daily Change %0.27
Today daily open1.3534
 
Trends
Daily SMA201.3523
Daily SMA501.3486
Daily SMA1001.3514
Daily SMA2001.3481
 
Levels
Previous Daily High1.3552
Previous Daily Low1.3521
Previous Weekly High1.3552
Previous Weekly Low1.3459
Previous Monthly High1.3606
Previous Monthly Low1.3366
Daily Fibonacci 38.2%1.3533
Daily Fibonacci 61.8%1.354
Daily Pivot Point S11.3519
Daily Pivot Point S21.3505
Daily Pivot Point S31.3489
Daily Pivot Point R11.355
Daily Pivot Point R21.3566
Daily Pivot Point R31.3581

Author

Sagar Dua

Sagar Dua

FXStreet

Sagar Dua is associated with the financial markets from his college days. Along with pursuing post-graduation in Commerce in 2014, he started his markets training with chart analysis.

More from Sagar Dua
Share:

Editor's Picks

EUR/USD recovers some early losses driven by rising energy prices amid US-Iran war

The EUR/USD pair claws back some of its early losses during the late Asian trading session on Monday, but is still 0.25% down to near 1.1780. Earlier in the day, the Euro declined sharply against the US Dollar as investors shifted to the safe-haven fleet amid the brutal war between Iran, Israel, and the United States, which broke out over the weekend.

GBP/USD targets 1.3500 barrier near moving averages

GBP/USD rebounds from the daily losses, trading around 1.3450 during the Asian hours on Monday. The technical analysis of the daily chart indicates an ongoing bearish bias, as the pair trades within a descending channel pattern.

Gold looks further north as Iran war boosts haven demand

Gold is taking a breather after the initial run to over one-month highs near $5,400, kicking off the new week with a bang. A global flight to safety theme, following the US-Israel joint attacks on Iran over the weekend, bolstered the demand for the traditional store of value, Gold.

Bitcoin, Ethereum and Ripple under pressure as key supports face breakdown risk

Bitcoin, Ethereum, and Ripple prices trade on the back foot at the start of this week on Monday, after extending losses in the previous week. BTC is on the brink of a breakdown, ETH is capped below key resistance, and XRP risks a crack of the trendline.

The market is paying for insurance, not apocalypse

As expected, this morning felt less like a Monday market open and more like a fire drill. Futures screens flickered red. S&P contracts down almost 1%. Nasdaq off 1.2%. Brent leaped 13% through $80. Gold rose 1.6% toward $5350 before paring some gains. The dollar is strutting mildly. The Swiss franc is quietly doing what it always does in a storm, catching some safe-haven flows.

Starknet unveils strkBTC, shielded Bitcoin transactions on Ethereum Layer 2

Starknet, the Ethereum Layer 2 network developed by StarkWare, today announced strkBTC, a wrapped Bitcoin asset that introduces optional shielding while preserving full DeFi composability.