USD/CAD Price Analysis: Key HMAs challenge bulls above 1.3700


  • USD/CAD holds lower grounds after declining below 50-HMA, 100-HMA.
  • Downbeat oscillators direct sellers towards a two-week-old ascending support line.
  • Bulls may aim for weekly resistance line on crossing 1.3740 hurdle.

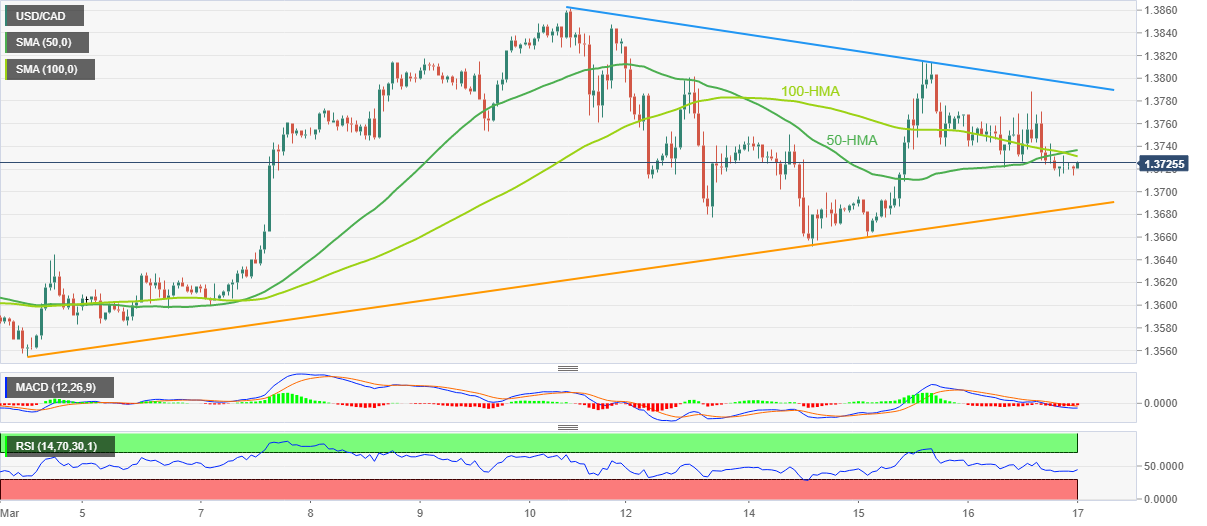
USD/CAD struggles for clear directions around 1.3720-25 after welcoming the bears the previous day. In doing so, the Loonie pair stays defensive while keeping Thursday’s downside break of the 100 and 50 Hourly Moving Averages (HMAs).

Not only the HMA breakdown but the bearish MACD signals and descending RSI (14), not oversold, also keeps the Loonie sellers hopeful of witnessing the further south-run.

That said, the 1.3700 threshold appears to be the immediate support for the USD/CAD sellers to watch ahead of a two-week-old ascending trend line, near 1.3690-85 at the latest.

In a case where the Loonie pair breaks 1.3685, the weekly low surrounding 1.3650 will gain the market’s attention before highlighting the monthly bottom of around 1.3555.

On the flip side, the 100-HMA and the 50-HMA restrict immediate USD/CAD recovery near 1.3730 and 1.3740 in that order.

However, a descending trend line stretched from the last Friday, near 1.3795, as well as the 1.3800 threshold, could restrict the pair’s upside past 1.3740.

Should the quote rally past 1.3740, the odds of witnessing a fresh Year-To-Date (YTD) high, currently around 1.3860, can’t be ruled out.

Overall, USD/CAD remains sidelined between the fortnight-old and weekly trend lines. However, the latest downside break of the HMAs and downbeat oscillators favor the intraday sellers.

USD/CAD: Hourly chart

Trend: Further downside expected

Additional important levels

Overview
Today last price 1.3723
Today Daily Change 0.0001
Today Daily Change % 0.01%
Today daily open 1.3722
 
Trends
Daily SMA20 1.3645
Daily SMA50 1.3492
Daily SMA100 1.3508
Daily SMA200 1.3335
 
Levels
Previous Daily High 1.3788
Previous Daily Low 1.3714
Previous Weekly High 1.3862
Previous Weekly Low 1.3582
Previous Monthly High 1.3666
Previous Monthly Low 1.3262
Daily Fibonacci 38.2% 1.3742
Daily Fibonacci 61.8% 1.376
Daily Pivot Point S1 1.3694
Daily Pivot Point S2 1.3667
Daily Pivot Point S3 1.362
Daily Pivot Point R1 1.3769
Daily Pivot Point R2 1.3815
Daily Pivot Point R3 1.3843


Share: Feed news

Information on these pages contains forward-looking statements that involve risks and uncertainties. Markets and instruments profiled on this page are for informational purposes only and should not in any way come across as a recommendation to buy or sell in these assets. You should do your own thorough research before making any investment decisions. FXStreet does not in any way guarantee that this information is free from mistakes, errors, or material misstatements. It also does not guarantee that this information is of a timely nature. Investing in Open Markets involves a great deal of risk, including the loss of all or a portion of your investment, as well as emotional distress. All risks, losses and costs associated with investing, including total loss of principal, are your responsibility. The views and opinions expressed in this article are those of the authors and do not necessarily reflect the official policy or position of FXStreet nor its advertisers. The author will not be held responsible for information that is found at the end of links posted on this page.

If not otherwise explicitly mentioned in the body of the article, at the time of writing, the author has no position in any stock mentioned in this article and no business relationship with any company mentioned. The author has not received compensation for writing this article, other than from FXStreet.

FXStreet and the author do not provide personalized recommendations. The author makes no representations as to the accuracy, completeness, or suitability of this information. FXStreet and the author will not be liable for any errors, omissions or any losses, injuries or damages arising from this information and its display or use. Errors and omissions excepted.

The author and FXStreet are not registered investment advisors and nothing in this article is intended to be investment advice.

Recommended content


Recommended content

Editors’ Picks

USD/JPY jumps above 156.00 on BoJ's steady policy

USD/JPY jumps above 156.00 on BoJ's steady policy

USD/JPY has come under intense buying pressure, surging past 156.00 after the Bank of Japan kept the key rate unchanged but tweaked its policy statement. The BoJ maintained its fiscal year 2024 and 2025 core inflation forecasts, disappointing the Japanese Yen buyers. 

USD/JPY News

AUD/USD consolidates gains above 0.6500 after Australian PPI data

AUD/USD consolidates gains above 0.6500 after Australian PPI data

AUD/USD is consolidating gains above 0.6500 in Asian trading on Friday. The pair capitalizes on an annual increase in Australian PPI data. Meanwhile, a softer US Dollar and improving market mood also underpin the Aussie ahead of the US PCE inflation data. 

AUD/USD News

Gold price flatlines as traders look to US PCE Price Index for some meaningful impetus

Gold price flatlines as traders look to US PCE Price Index for some meaningful impetus

Gold price lacks any firm intraday direction and is influenced by a combination of diverging forces. The weaker US GDP print and a rise in US inflation benefit the metal amid subdued USD demand. Hawkish Fed expectations cap the upside as traders await the release of the US PCE Price Index.

Gold News

Stripe looks to bring back crypto payments as stablecoin market cap hits all-time high

Stripe looks to bring back crypto payments as stablecoin market cap hits all-time high

Stripe announced on Thursday that it would add support for USDC stablecoin, as the stablecoin market exploded in March, according to reports by Cryptocompare.

Read more

US economy: Slower growth with stronger inflation

US economy: Slower growth with stronger inflation

The US Dollar strengthened, and stocks fell after statistical data from the US. The focus was on the preliminary estimate of GDP for the first quarter. Annualised quarterly growth came in at just 1.6%, down from the 2.5% and 3.4% previously forecast.

Read more

Forex MAJORS

Cryptocurrencies

Signatures