- USD/CAD finds cushion near 1.3500 as Oil prices drop on tighter supply concerns.
- The US Dollar moves higher while risk-sensitive currencies edge down amid uncertainty ahead of US data.
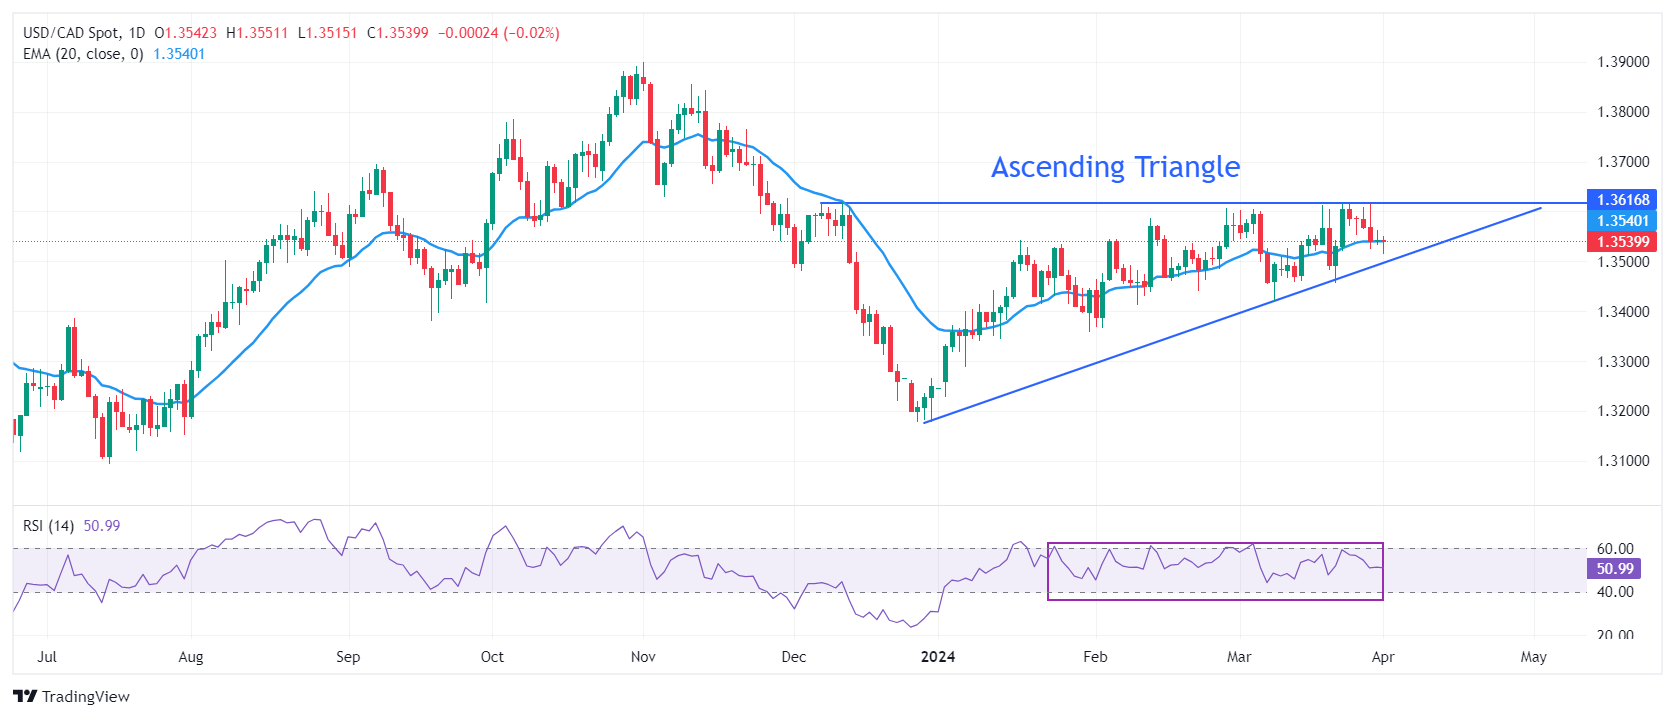
- The Loonie is expected to blow out of the ascending Triangle formation.
The USD/CAD pair discovers a temporary support near the psychological support of 1.3500 in the European session on Monday. The Loonie asset finds cushion as the Oil prices edge down after a three-day rally.
The appeal for the Oil prices remains buoyant on tighter supply concerns. OPEC pledges to extend production cuts by the June end. Also, Ukraine’s drone attacks on some Russian refineries have deepened supply concerns. It is worth noting that Canada is the leading exporter of oil to the United States and higher Oil prices strengthen the Canadian Dollar.
Meanwhile, the US Dollar rises slightly to 104.58 amid caution ahead of the United States Nonfarm Payrolls (NFP) and related labor market data this week. The market is experiencing asset-specific action as risk-perceived currencies are down while US equity futures have posted significant gains.
In today’s session, investors will focus on the United States ISM Manufacturing PMI data for March, which will be published at 14:00 GMT. The factory data is estimated to increase to 48.4 from 47.8 in February.
USD/CAD seems close to exploding the Ascending Triangle pattern formed on a daily time. The chart pattern exhibits a sharp volatility contraction. The upward-sloping border of the aforementioned pattern is placed from December 27 low at 1.3177 while horizontal resistance is plotted from December 7 high at 1.3620
The 20-day Exponential Moving Average (EMA) near 1.3520 remains stick to spot prices, indicating a consolidation ahead.
The 14-period Relative Strength Index (RSI) oscillates inside the 40.00-60.00 range, indicating indecisiveness among investors.
The Loonie asset would observe a fresh upside if it breaks above December 7 high at 1.3620. This will drive the asset towards May 26 high at 1.3655, followed by the round-level resistance of 1.3700.
On the flip side, a downside move below February 22 low at 1.3441 would expose the asset to February 9 low at 1.3413. A breakdown below the latter would extend downside towards January 15 low at 1.3382.
USD/CAD daily chart
Information on these pages contains forward-looking statements that involve risks and uncertainties. Markets and instruments profiled on this page are for informational purposes only and should not in any way come across as a recommendation to buy or sell in these assets. You should do your own thorough research before making any investment decisions. FXStreet does not in any way guarantee that this information is free from mistakes, errors, or material misstatements. It also does not guarantee that this information is of a timely nature. Investing in Open Markets involves a great deal of risk, including the loss of all or a portion of your investment, as well as emotional distress. All risks, losses and costs associated with investing, including total loss of principal, are your responsibility. The views and opinions expressed in this article are those of the authors and do not necessarily reflect the official policy or position of FXStreet nor its advertisers. The author will not be held responsible for information that is found at the end of links posted on this page.
If not otherwise explicitly mentioned in the body of the article, at the time of writing, the author has no position in any stock mentioned in this article and no business relationship with any company mentioned. The author has not received compensation for writing this article, other than from FXStreet.
FXStreet and the author do not provide personalized recommendations. The author makes no representations as to the accuracy, completeness, or suitability of this information. FXStreet and the author will not be liable for any errors, omissions or any losses, injuries or damages arising from this information and its display or use. Errors and omissions excepted.
The author and FXStreet are not registered investment advisors and nothing in this article is intended to be investment advice.
Recommended content
Editors’ Picks
EUR/USD stays in positive territory above 1.0850 after US data

EUR/USD clings to modest daily gains above 1.0850 in the second half of the day on Friday. The improving risk mood makes it difficult for the US Dollar to hold its ground after PCE inflation data, helping the pair edge higher ahead of the weekend.
GBP/USD stabilizes above 1.2850 as risk mood improves

GBP/USD maintains recovery momentum and fluctuates above 1.2850 in the American session on Friday. The positive shift seen in risk mood doesn't allow the US Dollar to preserve its strength and supports the pair.
Gold rebounds above $2,380 as US yields stretch lower

Following a quiet European session, Gold gathers bullish momentum and trades decisively higher on the day above $2,380. The benchmark 10-year US Treasury bond yield loses more than 1% on the day after US PCE inflation data, fuelling XAU/USD's upside.
Avalanche price sets for a rally following retest of key support level

Avalanche (AVAX) price bounced off the $26.34 support level to trade at $27.95 as of Friday. Growing on-chain development activity indicates a potential bullish move in the coming days.
The election, Trump's Dollar policy, and the future of the Yen

After an assassination attempt on former President Donald Trump and drop out of President Biden, Kamala Harris has been endorsed as the Democratic candidate to compete against Trump in the upcoming November US presidential election.