|

USD/CAD Price Analysis: Extends losing spell for fourth trading session

  • USD/CAD drops further to 1.3720 as the Canadian Dollar holds strength despite weak Oil prices.
  • This week, the US Core PCE Price Index and Q1 GDP data will guide the US Dollar.
  • USD/CAD corrects after a sharp rally, driven by an Ascending Triangle breakout.

The USD/CAD pair continues its losing streak for the fourth trading session on Monday. The Loonie asset drops to 1.3720 as investors have underpinned the Canadian Dollar against the US Dollar despite multiple headwinds.

The Canadian Dollar holds strength even though the Oil price plummets below $81.00. The appeal of the Oil price weakens as geopolitical risks ease after Friday's event in the Middle East indicated that Iran was downplaying Israel's limited retaliatory attack. Lower Oil prices generally dent demand for the Canadian Dollar, as Canada is the leading exporter of Oil to the United States.

Also, the soft Canadian inflation outlook fails to dampen the Canadian Dollar outlook. Bank of Canada’s (BoC) preferred inflation measure that excludes eight volatile items annually ease to 2% in March, prompting expectations of early rate cuts.

Meanwhile, the US Dollar consolidates above 106.00 as investors shift focus to the preliminary Q1 Gross Domestic Product (GDP) and the core Personal Consumption Expenditure Price Index (PCE) data for March, which will be published on Thursday and Friday, respectively.

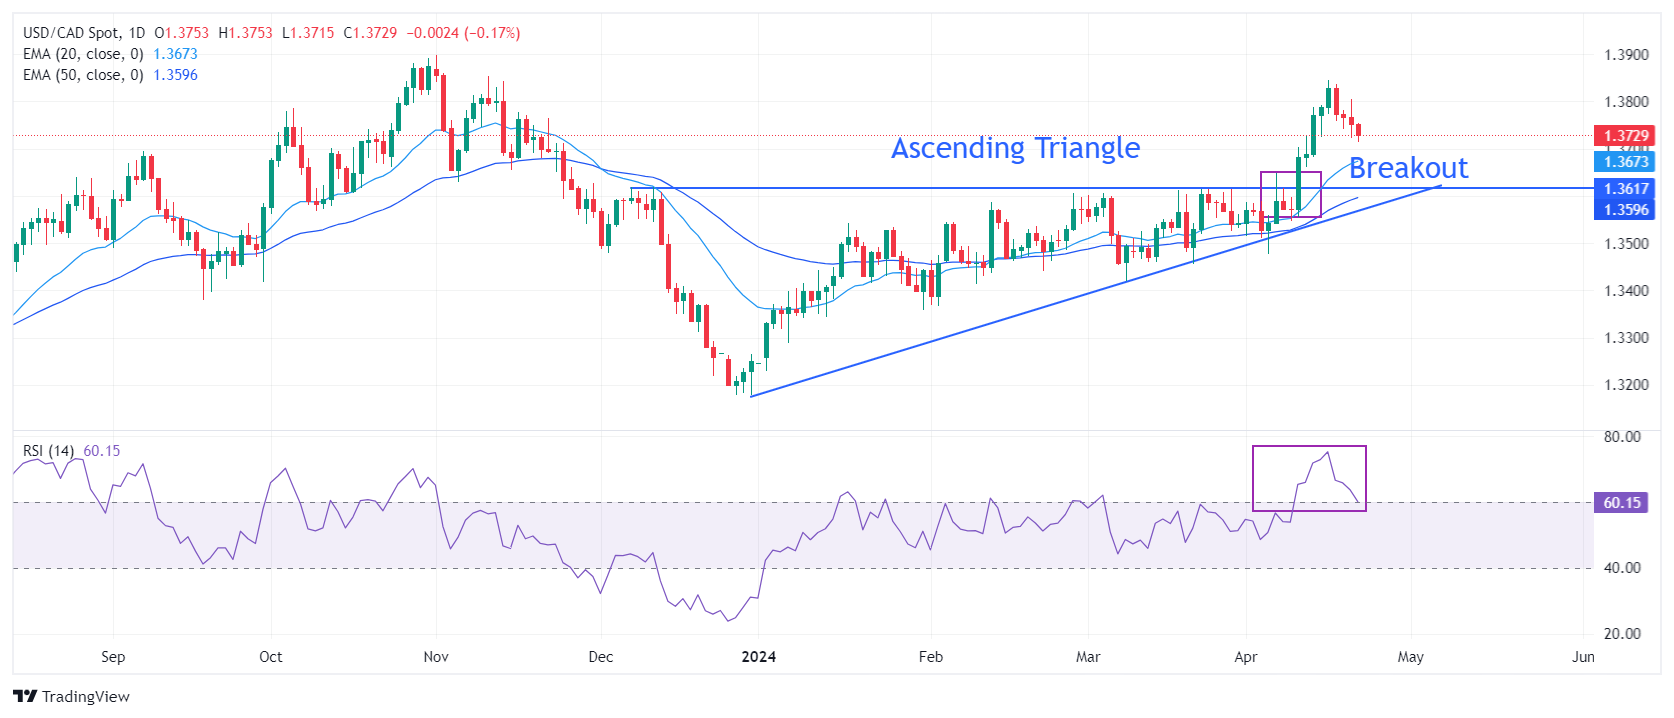
USD/CAD delivered a sharp rally after a breakout of the Ascending Triangle chart pattern formed on a daily timeframe. The near-term outlook remains strong as the 20- and 50-day Exponential Moving Averages (EMAs), which trades around 1.3680 and 1.3600, respectively, are moving higher.

The 14-period Relative Strength drops to near 60.00 but still holds inside the bullish range of 60.00-80.00.

As a mild correction is generally followed by a sharp rally after a breakout, a mean-reversion move to near the 20-day EMA around 1.3680 will present a buying opportunity to market participants. Investors would find resistance near the 22 November 2023, high at 1.3766, followed by the round-level resistance of 1.3800.

In an alternate scenario, a breakdown below April 9 low around 1.3547 will expose the asset to the psychological support of 1.3500 and March 21 low around 1.3456.

USD/CAD daily chart

USD/CAD

Overview
Today last price1.373
Today Daily Change-0.0023
Today Daily Change %-0.17
Today daily open1.3753
 
Trends
Daily SMA201.3641
Daily SMA501.3569
Daily SMA1001.3495
Daily SMA2001.3529
 
Levels
Previous Daily High1.3805
Previous Daily Low1.3724
Previous Weekly High1.3846
Previous Weekly Low1.3724
Previous Monthly High1.3614
Previous Monthly Low1.342
Daily Fibonacci 38.2%1.3754
Daily Fibonacci 61.8%1.3774
Daily Pivot Point S11.3716
Daily Pivot Point S21.3679
Daily Pivot Point S31.3635
Daily Pivot Point R11.3797
Daily Pivot Point R21.3841
Daily Pivot Point R31.3878

Author

Sagar Dua

Sagar Dua

FXStreet

Sagar Dua is associated with the financial markets from his college days. Along with pursuing post-graduation in Commerce in 2014, he started his markets training with chart analysis.

More from Sagar Dua
Share:

Markets move fast. We move first.

Orange Juice Newsletter brings you expert driven insights - not headlines. Every day on your inbox.

By subscribing you agree to our Terms and conditions.

Editor's Picks

EUR/USD trims losses and returns to the 1.1750 area

The US Dollar resumed its decline in the American afternoon, helping EUR/USD trim early losses. The pair trades around 1.1750 as market participants gear up for the European Central Bank monetary policy decision and the United States Consumer Price Index.

GBP/USD flirts with 1.3400 after nearing 1.3300

The GBP/USD changed course after dipping with UK inflation data, and trades near the 1.3400 mark, as investors expect the Bank of England to deliver a 25 basis points interest rate cut after the two-day meeting on Thursday.

Gold maintains its positive momentum, trades around $4,330

The XAU/USD pair gained on a deteriorated market mood, trading near its weekly highs near $4,340. The bright metal advances with caution as market players await first-tier events in Europe and hte United States.

Bitcoin risks deeper correction as ETF outflows mount, derivative traders stay on the sidelines

Bitcoin (BTC) remains under pressure, trading below $87,000 on Wednesday, nearing a key support level. A decisive daily close below this zone could open the door to a deeper correction.

Monetary policy: Three central banks, three decisions, the same caution

While the Fed eased its monetary policy on 10 December for the third consecutive FOMC meeting, without making any guarantees about future action, the BoE, the ECB and the BoJ are holding their respective meetings this week. 

Crypto Today: Bitcoin, Ethereum, XRP slide further as risk-off sentiment deepens

Bitcoin faces extended pressure as institutional investors reduce their risk exposure. Ethereum’s upside capped at $3,000, weighed down by ETF outflows and bearish signals. XRP slides toward November’s support at $1.82 despite mild ETF inflows.