|

USD/CAD Price Analysis: Extends its upside on unexpectedly robust preliminary US PMI growth

  • USD/CAD bounces back strongly after upbeat US preliminary S&P Global PMI report for June.
  • Canadian Retail Sales grew expectedly by 0.7%.
  • The Fed is expected to deliver two rate cuts this year.

The USD/CAD pair recovers strongly from 11-day low near 1.3670 in Friday’s American session. The Loonie asset bounces back as the US Dollar (USD) extends its upside after the US S&P Global PMI data for June shows that the Composite PMI surprisingly outperformed expectations that were pointing to slowdown in activity.

The US Dollar Index (DXY), which tracks the Greenback’s value against six major currencies, jumps to six-week high near 105.90.

However, investors are still uncertain about the US Dollar’s outlook as investors expect that the Federal Reserve (Fed) will start reducing interest rates from the September meeting. Market participants expect that the Fed will cut interest rates twice this year. On the contrary, Fed policymakers continue to argue in favor of reducing interest rates only once this year.

Meanwhile, the Canadian Dollar barely moved as Canada’s Retail Sales for April grew in line with expectations of 0.7% month-on-month. The Retail Sales data comes out positive after contracting for straight three months.

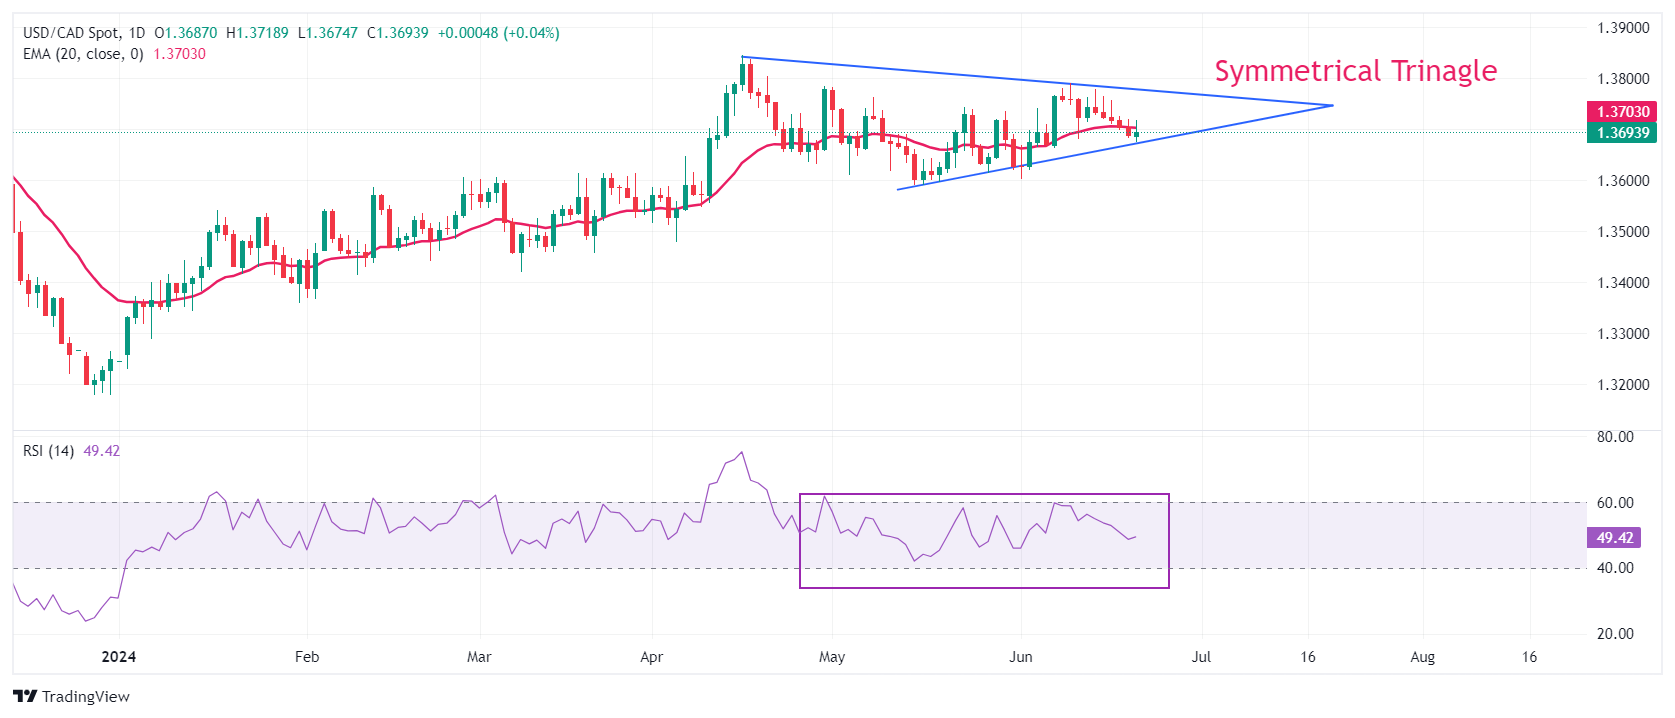
USD/CAD trades in a Symmetrical Triangle chart pattern, which indicates a sharp volatility contraction. Spot prices remain sticky to the 20-day Exponential Moving Average (EMA) near 1.3700, indicating a sideways trend.

The 14-period Relative Strength Index (RSI) oscillates in the 40.00-60.00 range, suggesting indecisiveness among market participants.

Fresh buying opportunity would emerge if the asset breaks above April 17 high at 1.3838. This would drive the asset towards 1 November 2023 high at 1.3900, followed by the psychological resistance of 1.4000.

In an alternate scenario, a breakdown below June 7 low at 1.3663 will expose the asset to May 3 low around 1.3600 and April 9 low around 1.3547.

USD/CAD daily chart
USD/CAD

Overview
Today last price1.3692
Today Daily Change0.0003
Today Daily Change %0.02
Today daily open1.3689
 
Trends
Daily SMA201.3698
Daily SMA501.3698
Daily SMA1001.3615
Daily SMA2001.3584
 
Levels
Previous Daily High1.3721
Previous Daily Low1.3682
Previous Weekly High1.3792
Previous Weekly Low1.368
Previous Monthly High1.3783
Previous Monthly Low1.359
Daily Fibonacci 38.2%1.3697
Daily Fibonacci 61.8%1.3706
Daily Pivot Point S11.3674
Daily Pivot Point S21.3659
Daily Pivot Point S31.3635
Daily Pivot Point R11.3713
Daily Pivot Point R21.3736
Daily Pivot Point R31.3751

Author

Sagar Dua

Sagar Dua

FXStreet

Sagar Dua is associated with the financial markets from his college days. Along with pursuing post-graduation in Commerce in 2014, he started his markets training with chart analysis.


More from Sagar Dua
Share:

Editor's Picks

AUD/USD sits near monthly high, around 0.7035 on hawkish RBA

AUD/USD trades around 0.7030-0.7035 in the Asian session on Thursday, near its monthly top, as recent hawkish comments from RBA officials continue to underpin the Australian Dollar. The US Dollar, meanwhile, struggles to lure buyers amid further declines in US bond yields, adding support to the pair. However, Fed rate-hike bets and geopolitical uncertainty help limit losses for the safe-haven buck, warranting caution for Aussie bulls.

USD/JPY remains confined in a familiar range; holds steady above 158.00

USD/JPY extends its consolidative price action through Thursday's Asian session, trading just above 158.00 amid diverging forces. Uncertainty over the timing of the next BoJ rate hike keeps Japanese Yen bulls on the defensive. The US Dollar, meanwhile, languishes near multi-week low amid declining US bond yields. Furthermore, looming intervention risks limit JPY losses and cap the pair. Traders also seem hesitant ahead of the Fed and BoJ meetings next week.

Gold hangs near one-week low; eyes $4,100 break amid Fed hike bets

Gold attracts fresh sellers in Thursday’s Asian session, sliding closer to a one-week low touched the previous day. Firming expectations for an imminent Fed rate hike, bolstered by oil-driven inflation risks, weigh on the non-yielding bullion. Meanwhile, declining US bond yields counter geopolitical uncertainty, keeping US Dollar bulls on the defensive. This helps XAU/USD defend $4,100.

XRP and XLM recovery stalls below EMAs
Ripple (XRP) and Stellar (XLM) remain under pressure on Thursday as both struggle to sustain their recent recovery attempts. XRP trades below $1.36, while XLM slips beneath $0.183, as mixed derivatives metrics, weakening momentum indicators and heating market conditions suggest cautious market sentiment. Derivatives data shows weakening conditions for Ripple and Stellar.
What the midterm elections mean for Treasury yields, the Dollar and Gold
Democrats are priced to take the House, so November 3 comes down to the Senate and how much Washington can borrow without the other party. Treasury yields will show the answer first, then the Dollar and Gold. On November 3, Americans vote for all 435 House seats and 35 Senate seats. For bond prices, the result comes down to one thing: how much the government will borrow over the next two years.
The US Dollar fell. Gold didn't rally. That tells you everything
Gold (XAU/USD) is struggling to capitalize on a weaker US Dollar (USD), after repeatedly failing to establish itself above the $4,200 level. The precious metal remains confined to a relatively narrow trading range despite a combination of developments that would normally support higher prices.